It never occurs to agents to properly conduct a bidding war where the market decides the winner.
Instead, they choose the easy route and just collect offers, itemize them on a spreadsheet, and then point out a winner to the sellers. It is an ego-boosting choice that fares well around the brokerage’s water cooler, but is likely to leave loads of money on the table.
Agents who deny open bidding and just process one round of blind offers are clerks, not salesmen.
By the time they got the last offer, Quinn and Daryn Shapurji had received 54 bids on their four-bedroom, single-family house in Fishers, Ind., in just three days. Ms. Shapurji said they felt totally overwhelmed — and a bit melancholy.
“We felt bad that we had to say no to so many people, because we got a lot of beautiful letters from buyers saying how much they loved our house and why they wanted to live in the area,” said Ms. Shapurji, 32, a closing coordinator for a home builder. “Some buyers had already struck out on five or six homes.”
Chris Dossman, the couple’s real estate agent, suggested they take a cash offer that was $25,000 above their home’s list price of $220,000. “It wasn’t the highest offer they received, but the cash buyer waived the appraisal, so we knew that we weren’t going to have an issue with the home closing from a financing perspective,” said Ms. Dossman, an agent with Century 21 Scheetz based in Indianapolis.
“Fifty-four offers is by far the highest number of offers that I’ve ever received for a listing,” added Ms. Dossman, who has been an agent for 15 years.
“We’re seeing an inventory crisis,” said Katie Wethman, a Washington, D.C.-based real estate agent at Keller Williams Realty. Indeed, total home supply at the end of March sat at only 1.07 million units, down 28.2 percent from a year ago, according to the National Association of Realtors. The association’s data also found that homes typically sold in a record-low time of just 18 days in March, down from a 29-day average in March 2020.
Still, sellers face a challenge: “Getting inundated with offers can be overwhelming, and it can make it harder for sellers to choose the best offer,” said Alicia Stoughton, a real estate agent and designer at Keller Williams Advisors in Cincinnati, Ohio.
Why? Because “the highest offer isn’t always the best offer,” Ms. Stoughton said.
Here are the factors sellers should consider, in addition to purchase price, when evaluating multiple offers.
“Cash is king,” according to Nancy Newquist-Nolan, a real estate agent at Coldwell Banker in Santa Barbara, Calif. “I often recommend sellers take a cash offer, even if it’s not the highest offer.”
Still, mortgage buyers aren’t completely out of the running, said Ms. Wethman. “If you’re confident in the buyer’s lender and their ability to get approved for a mortgage, there’s not a lot of risk taking an offer from a buyer who’s getting a loan,” she said. Her advice to sellers? “Do your due diligence on the lender who is providing the funds,” she recommends.
This is a step where sellers can lean on their listing agent, Ms. Newquist-Nolan said. “I call up the lender and ask how qualified the buyer is for their loan,” she said. Moreover, “some lenders are notorious for dragging their feet and missing key deadlines.”
The best approach that sellers can take when weighing offers, Mr. Lejeune said, is to compare them side-by-side. His strategy: “I present offers to my clients in an Excel spreadsheet that specifics the offer price, loan amount, type of loan, contingencies, and other important metrics,” he said. “It’s basically a cheat sheet for sellers.”
Ms. Dossman is also a fan of presenting offers in a spreadsheet. As she puts it, “You want to have all the information in front of you when you’re making a decision.”
Many buyers attach personal letters with their offers to try to sway the sellers in their favor. But some real estate agents don’t even show sellers these letters when they present offers to avoid the possibility of unlawful bias against a buyer. But Ms. Dossman said she will share letters after vetting them to make sure there isn’t any information that could raise the potential for fair housing violations.
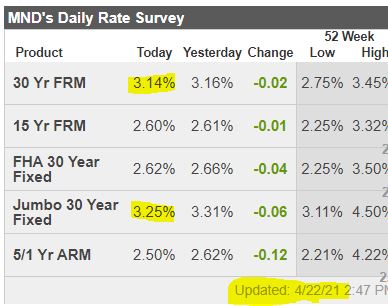
Mortgage rates have settled down nicely, and are back in the high-2s for those home buyers who don’t mind paying a half-point or so (those quoted above are with zero points paid).
Not sure that it matters. Not sure that anything matters any more.
I had a great conversation with a top Compass agent today discussing the market conditions.
Specifically, what do you tell buyers?
Thankfully, the market is so hot that we have more sales to rely on. Even with the prices going up, at least there are a few recent sales nearby that help to substantiate the trend.
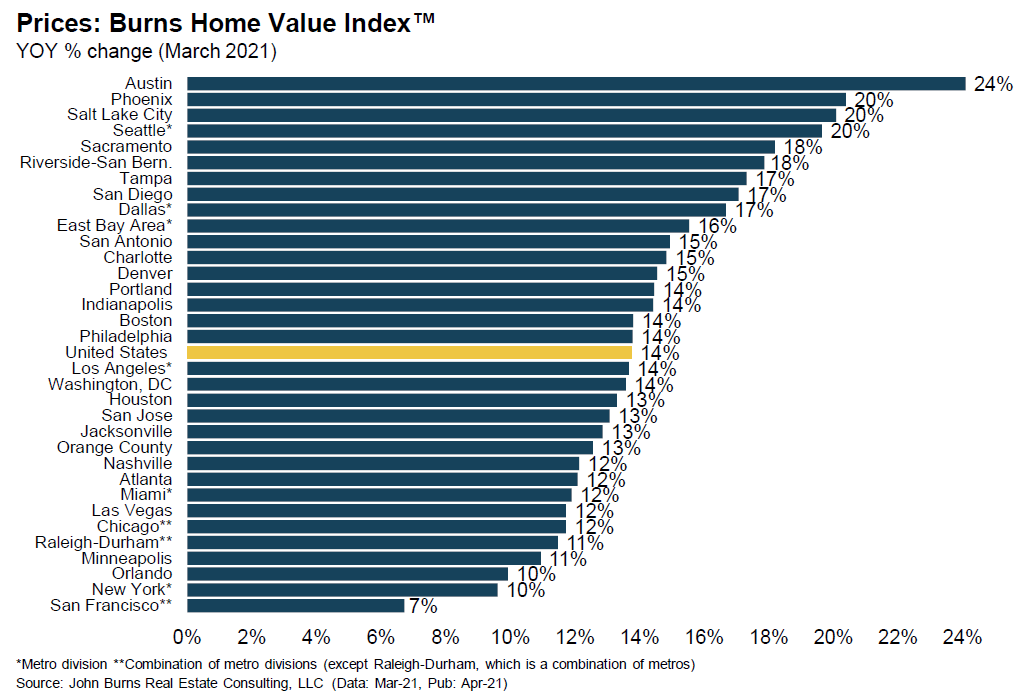
Is adding 1% per month to pricing enough to keep up with the actual? 1.5%?
Or how about 2.0% per month in the quality mid-range markets, both local and national?
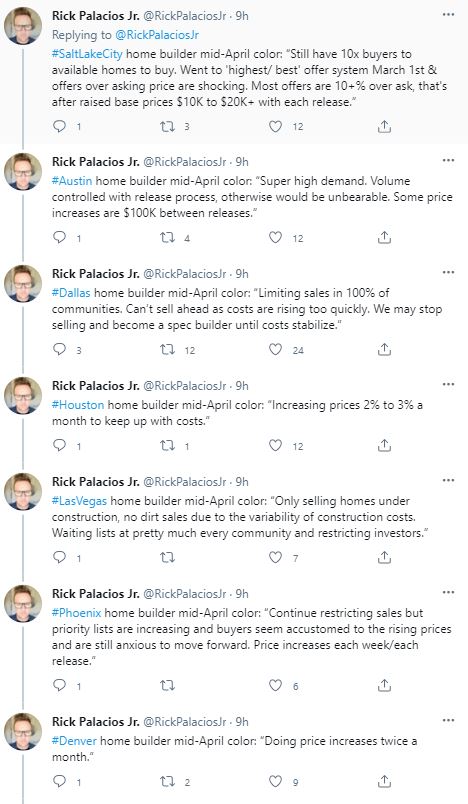
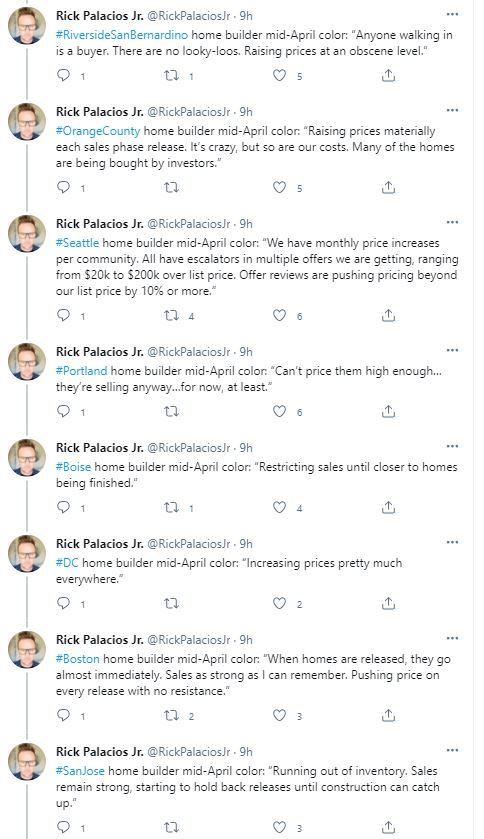
Rick is the Director of Research at JBREC and a great guy:
Some interesting housing color from mid-April around the country home builder channel check. Bunch of market commentary to follow…will try to hit most top markets.
The author first explored this topic in 2015, and this follow-up article was published in February:
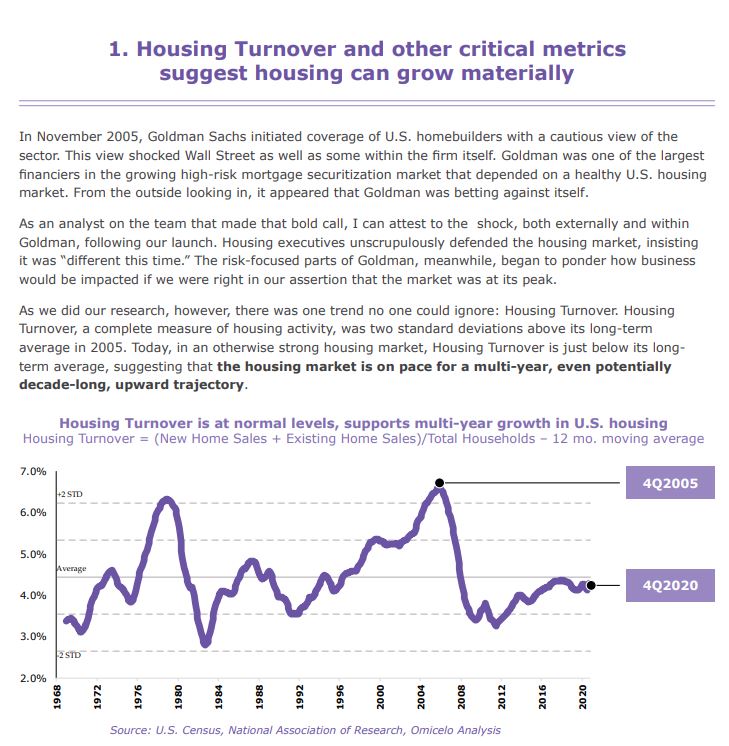
Welcome to the Brave New Housing Cycle: Factors indicate that an extended housing boom is underway.
A new long-term housing boom is upon us. And COVID-19 is the main reason why.
Both housing and economic cycles used to last five to seven years, but the economy has shifted to longer cycles, due to factors such as technology and monetary policy. The housing market has followed suit and the result is what I have defined as the Brave New Housing Cycle, which is poised to last seven to 10 years.
The current Brave New Housing Cycle actually started last year.
Yesterday we saw that more than half of the NSDCC houses sold over the last couple of months have closed for a price that’s higher than their list price.
Another difference from previous years is the efficiency.
Typically, there are only around 55% to 60% of the listings that actually sell each year – mostly due to agents re-freshing their listings repeatedly, sellers changing their mind, and wrong pricing.
What a huge difference in the Covid Era.
We have fewer homes for sale, but more of them are selling:
NSDCC Listings Between December 1st and January 31st
Year
Number of Listings
Number of Listings Pending or Sold By March 12th
%
2020
526
253
48%
2021
460
328
71%
Before Covid was declared, we had come into 2020 with low rates and renewed optimism, and the market was active as participants were finding their way, price-wise. There were 48% of the early listings that found a buyer before Covid kicked in on March 12th.
This year, the higher-end market is healthy, but the Under-$2,000,000 is blistering hot:
NSDCC Listings Under $2,000,000 Between December 1st and January 31st
Year
Number of Listings Under $2M
Number of Listings Pending or Sold By March 12th
%
2020
329
206
63%
2021
237
210
89%
89%!
When you are telling your grandkids about THE GREATEST REAL ESTATE FRENZY OF ALL-TIME, come back to this page!
The trend of paying over the list price continues!
NSDCC Detached-Home Sales, % Closed Over List Price
January: 38%
February: 43%
March: 53%
1/2April: 57%
Most sellers and agents are happy just to get 1% to 5% over list. There were only 18 of 173 (10%) that sold for a double-digit percentage over list. The big winners:
Most % Over List Price
List Price
Sales Price
Percentage Over List Price
$969,000
$1,210,000
25%
$1,399,000
$1,700,000
22%
$1,099,000
$1,316,000
20%
$1,425,000
$1,675,000
18%
$3,000,000
$3,500,000
17%
$1,499,000
$1,750,000
17%
$999,000
$1,160,000
16%
NSDCC Sales, April (First Half): 173
(the number of sales was 45% higher than same period in 2019)
Last week I mentioned that because there was a drop-off in pendings, we might have hit peak frenzy. But I didn’t consider the usual spring break lull – we’re right back at it now:
Two Weeks Ago:
Actives: 334
Pendings: 362
Last week:
Actives: 357
Pendings: 344
This Week:
Actives: 335
Pendings: 358
The action under $2,000,000 is phenomenal – look at the NSDCC active-to-pending ratios:
This week we heard the the news that homes.com was acquired:
Homes.com has a similar business model to massive real estate website Zillow, at least as far as Zillow’s core business goes. Homes.com is a property listing portal that helps agents and brokers market properties. The platform supports more than a half-million agents and brokers, and the website receives about 5 million unique visitors each month in the form of buyers searching listings.
For the time being, Homes.com is a much smaller business. Zillow’s real estate platform received more than 200 million unique monthly users in the fourth quarter of 2020 and was visited 2.2 billion times altogether. And Zillow has a rapidly growing business of directly buying and selling homes, while Homes.com is solely a home search platform. What’s more, keep in mind that CoStar is buying Homes.com for $156 million — Zillow’s market cap is about $34 billion.
However, it’s not just Homes.com anymore. Once it’s brought under CoStar’s umbrella, it will join forces with brands like the LoopNet commercial real estate marketplace (an area where Zillow doesn’t operate), Apartments.com, Apartment Finder, and most importantly, the Homesnap real estate agent workflow software business.
Homesnap is another recent acquisition, purchased by CoStar in December 2020. The Homesnap platform offers a marketing platform for agents, and CoStar plans to take advantage of the combination with Homes.com. As CEO Andrew Florance said in the press release announcing the acquisition, “Our plan in bringing Homesnap and Homes.com together is to help agents market their listings in support of the ‘your listing, your lead’ philosophy — which stands in contrast to most players in the industry.”
Can any home-search portal keep up with Zillow? They would need to spend the big bucks on advertising like Zillow does, just to be in the running. Zillow already has the name-brand recognition, a huge lead in monthly visitors, and they have the killer instinct and willingness to spend big on advertising – including key product placement. Displaying their for-sale signs in their ads will further establish them as a national brokerage in the mind of the consumer: