Are you thinking of going somewhere that doesn’t have bidding wars? You need to go a ways!
Just in case you haven’t heard, snagging a well-priced home in today’s real estate market can feel a bit like winning Powerball. It’s all about beating sky-high odds. Scant inventory, worsened by a pandemic-crush to buy new homes, has led to prices reaching new records and competition bidding them up even higher. All-cash bids and multiple offers way above asking are pricing many would-be homeowners right out of the market, or leaving them feeling hopeless.
“Demand has actually been growing stronger than supply going all the way back to 2014,” says Doug Duncan, chief economist at Fannie Mae. “It’s just that in 2020, incredibly low interest rates augmented that demand.”
In other words, we’ve found ourselves in an extreme seller’s market.
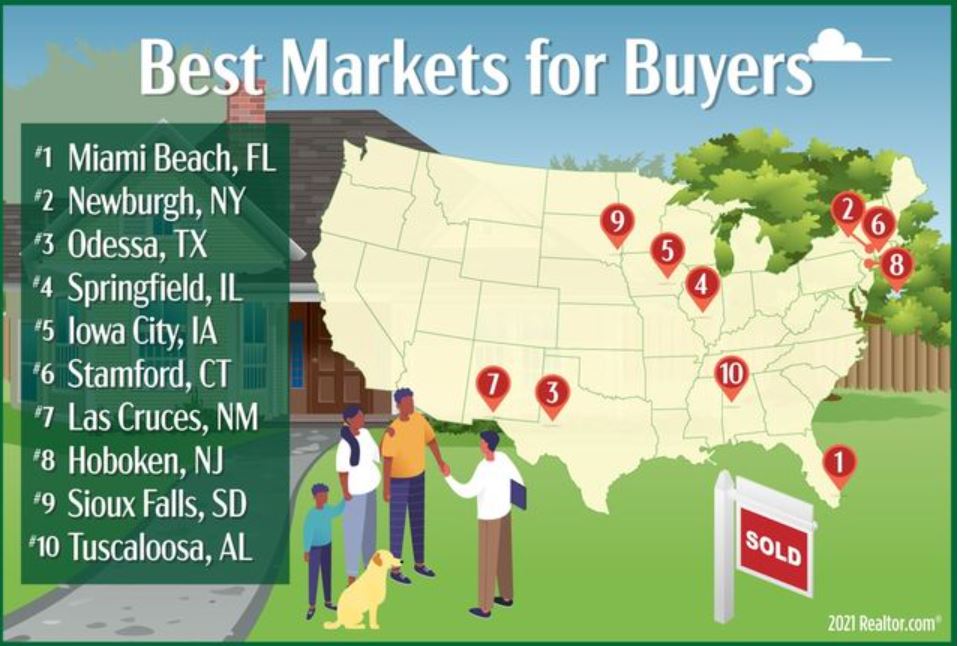
But not everywhere. The Realtor.com® data team found the places where buyers could actually have the advantage. Buyers in these spots—which tend to be smaller cities and college towns—have more properties available to choose from, and prices haven’t risen too much (if at all) compared with where they were at the start of the COVID-19 pandemic. This doesn’t mean home prices haven’t risen and the competition isn’t fierce in these cities—they’re just better than the rest of the country.
Looking ahead, buyers may get some more relief in the coming months as sellers become more comfortable listing their homes. Rising mortgage rates and the increase in inventory could slow down price gains. And while prices likely won’t drop, or at least by much, it could lead to a bit less competition.
But where can buyers get at least a little relief right now? To come up with our list of places, we looked at cities where home prices had not risen more than 10% in the past year (compared with 16% nationally) and calculated the number of homes for sale per 1,000 households—the more the better. All of the cities had at least 50,000 residents, and we limited the list to one city per state to achieve geographic diversity.
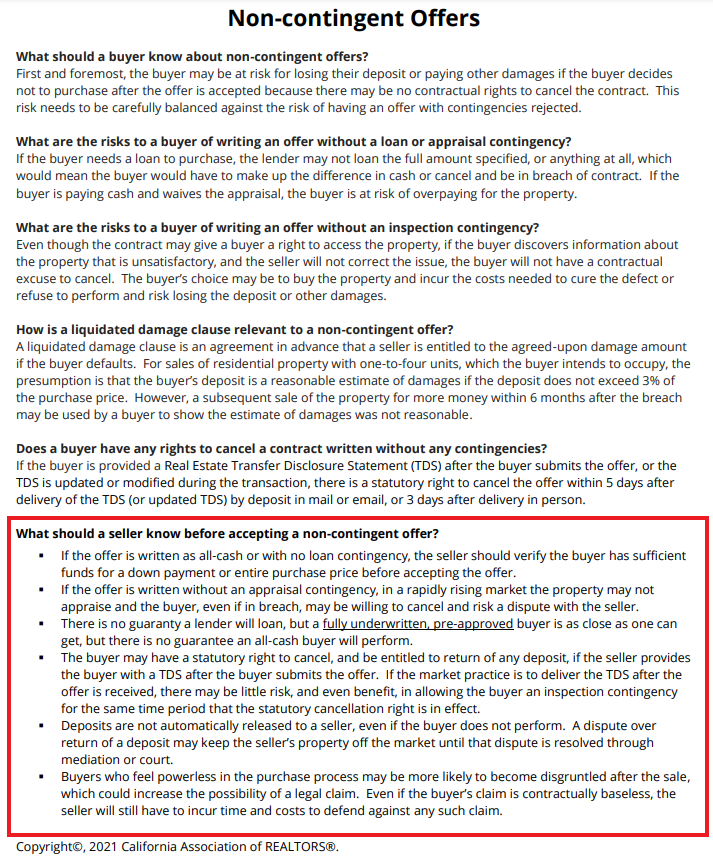
It’s getting to the point where it is so competitive that buyers will be tempted to make offers without contingencies to improve their chances of winning. But let’s face it, they would do so reluctantly.
Sellers should be very cautious about taking an offer with no contingencies.
You will be making a deal that would have maximum buyer’s remorse. If the buyers change their mind, and they insist on fighting for the deposit, it will tie up the property so you can’t sell it to anyone else.
Are you going to chase them around for 6-12 months to try to get their deposit and risk missing the peak – and screw up your plans for moving too?
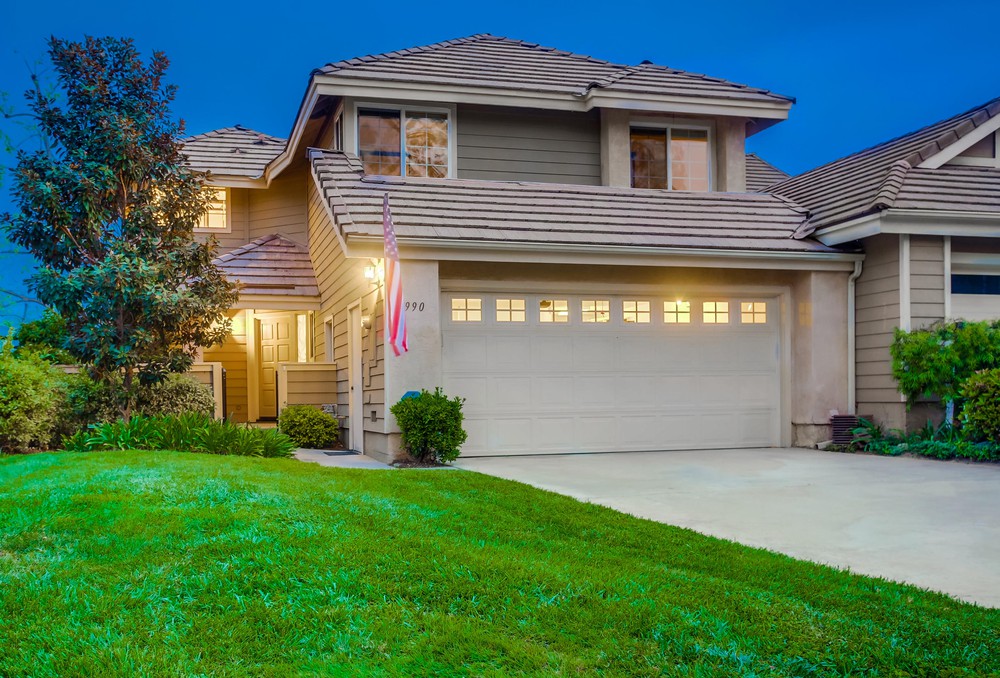
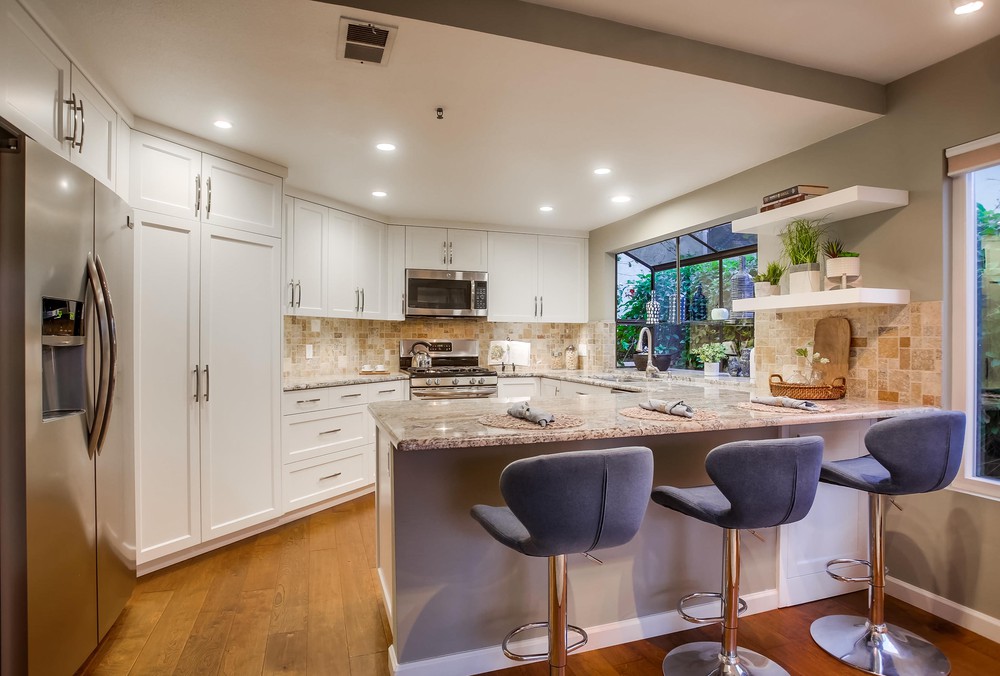
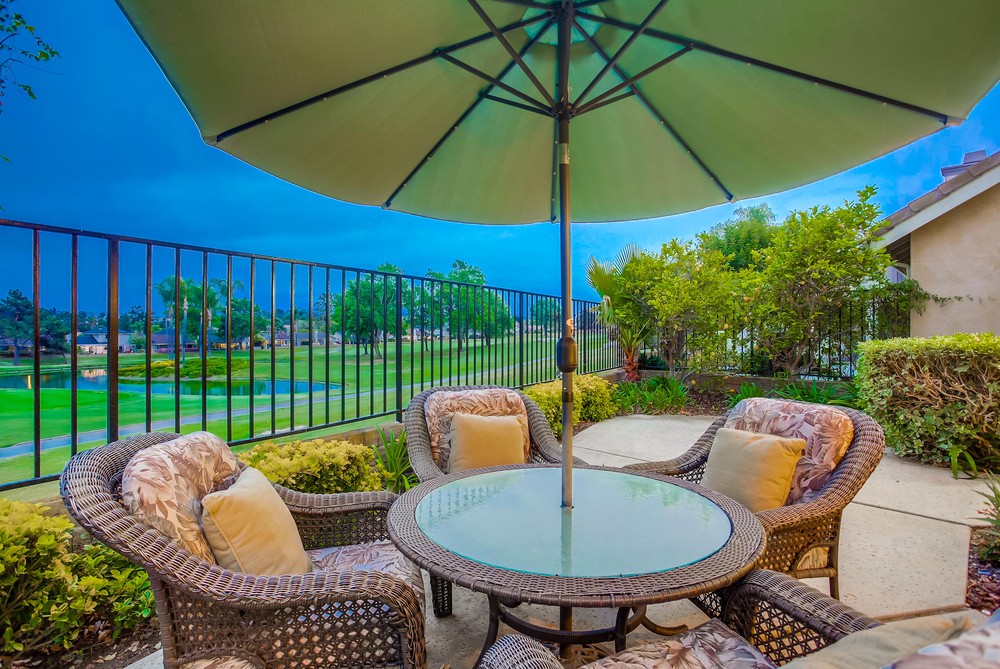
Part of the challenge of the low-inventory era is to find the hidden gems. Travel into south Vista just two miles from Carlsbad and look how much further your money goes!
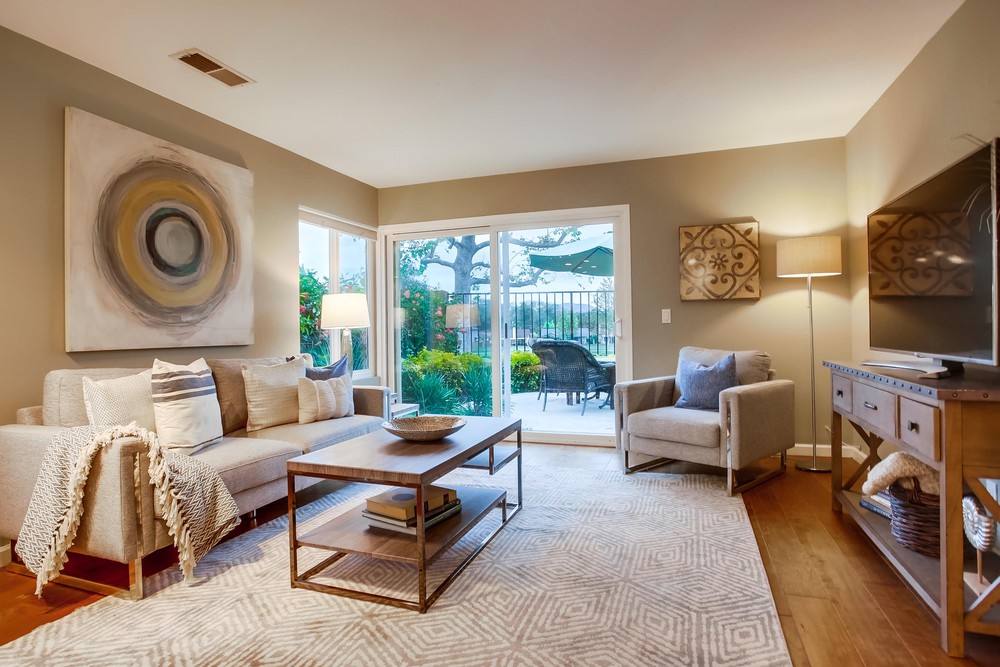
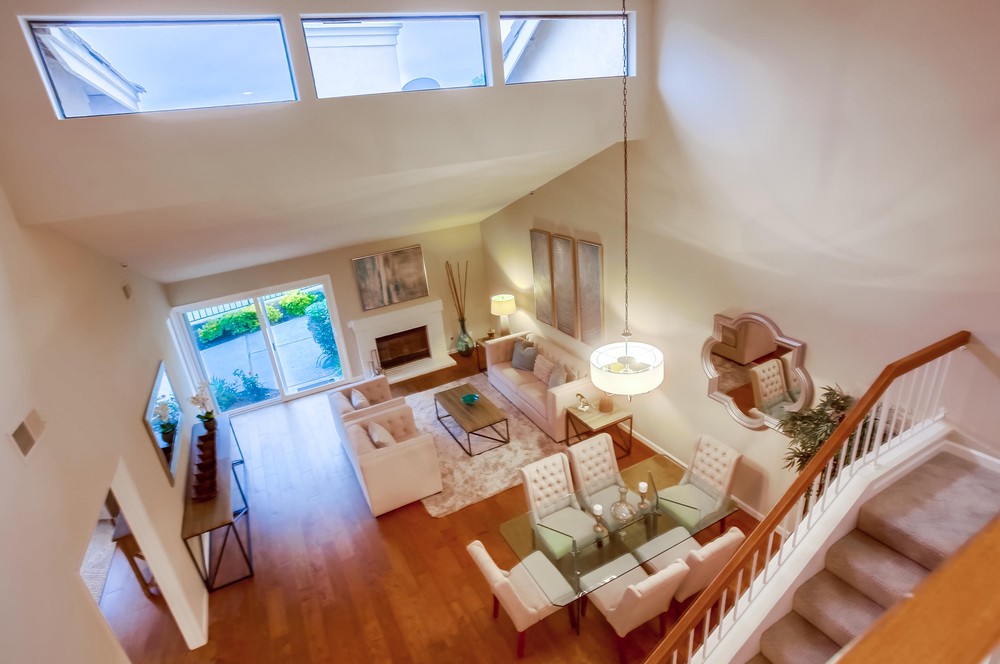
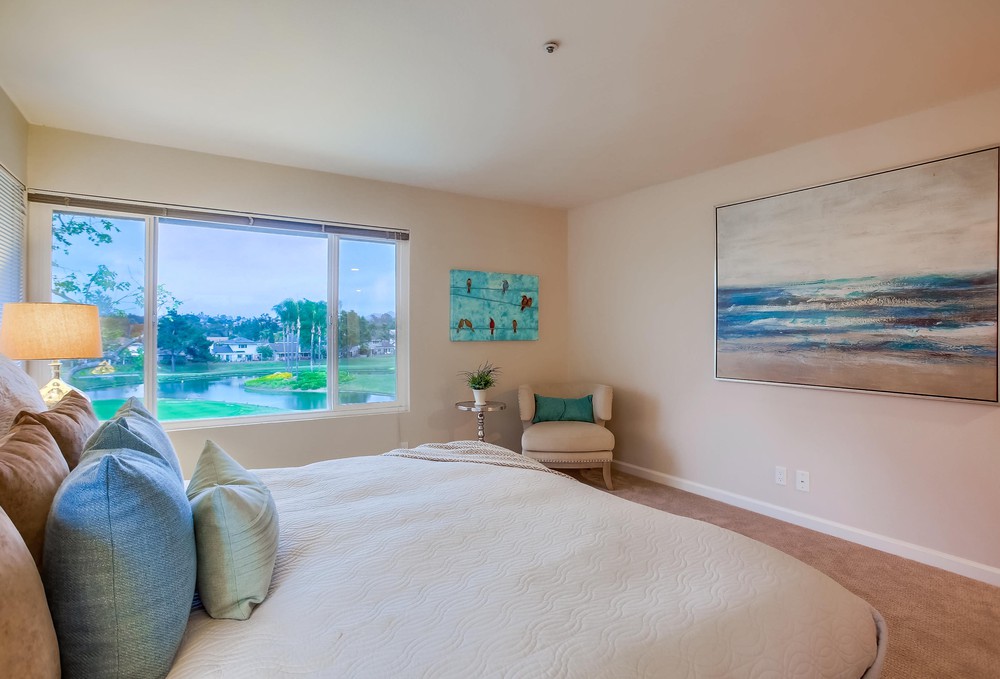
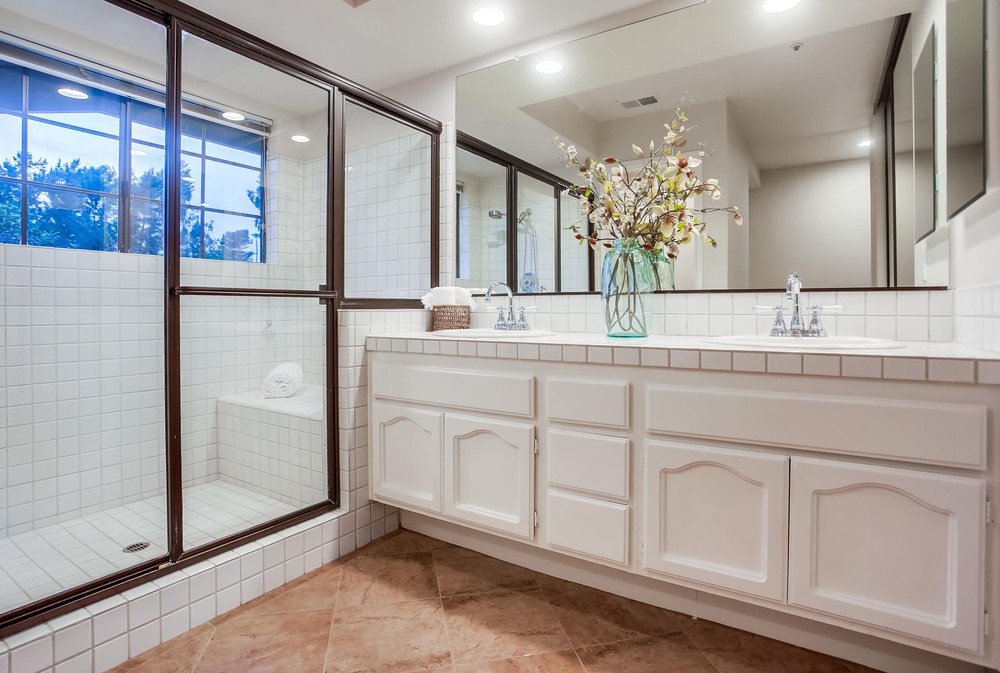
Here’s our new listing that overlooks the private Shadowridge Golf Club for only $699,000!
1990 Spyglass Circle, Vista
3 br/2.5 ba, 1,835sf
YB: 1988
HOA fee: $165/mo
The former model home ideally located above the 8th green has been beautifully remodeled and is better than new! Hardwood floors, new carpet and paint, newer kitchen and tuned-up baths! Located in a highly-desirable community with low HOA and no Mello-Roos, plus community pool & spa. Check it out!
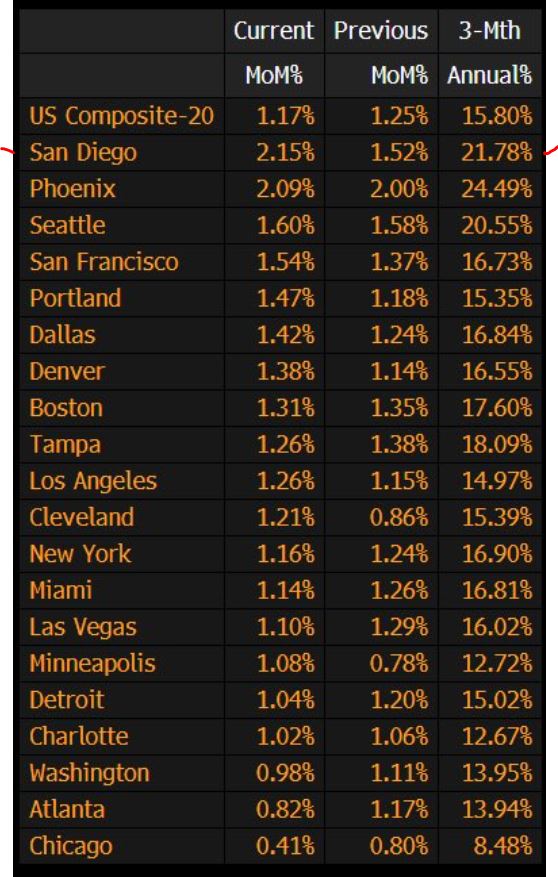
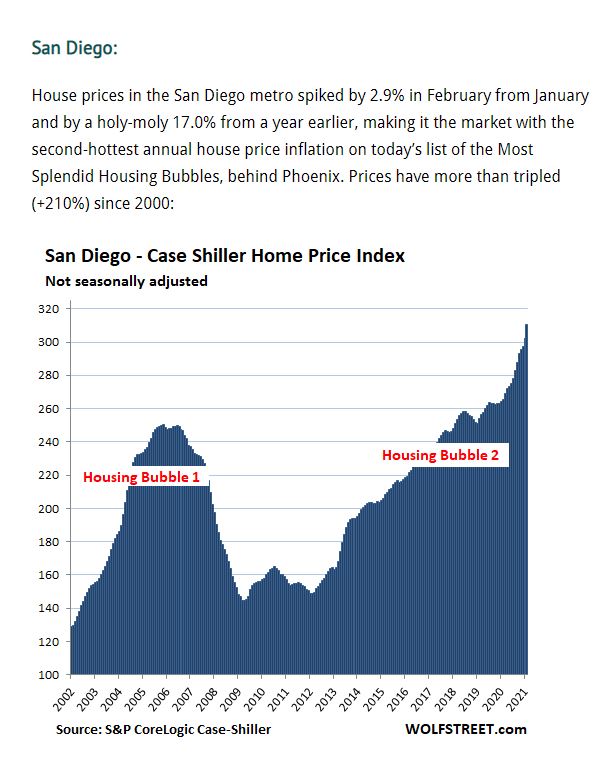
Our seasonally-adjusted Case-Shiller Index rose more in one month than any other U.S. metro area!
The increase in the three-month annual percentage was nearly 22%, and it doesn’t include March and April which have been hotter.
The San Diego index was still positive during the initial Covid months (but muted), so it’s safe to say that the year-over-year percentage increase for the next few readings will be substantially higher than February’s.
Could San Diego end up with 30% appreciation in 2021?
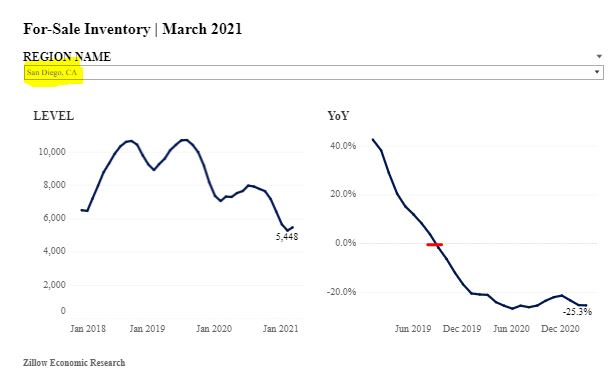
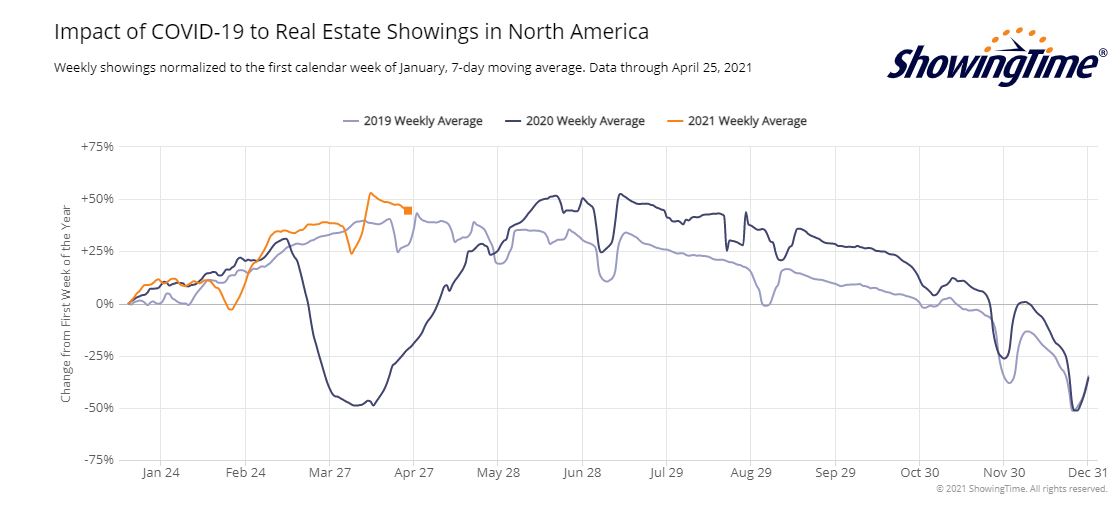
Zillow is optimistic that we will see more homes being listed for sale:
In prior years, inventory has generally increased in March, and the return to some seasonal normality is a positive sign that the market is reaching a more steady state and could see inventory rise more steadily going forward. With home values skyrocketing, vaccination rates rising, and employees getting long-term guidance on where they can work, we expect an increasing number of homeowners to enter the market and list in coming months. That will come as welcome news to home shoppers enmeshed in bidding wars and watching homes get plucked off the market weeks faster than usual.
But their graph shows an interesting trend. Our inventory had already been dropping since the middle of 2019, and is probably why the beginning of 2020 felt hotter than usual:
If we are nearing two years’ worth of declining inventory, than it wasn’t just a Covid-related event – which means the low-inventory environment will persist after Covid is gone.
If baby-boomers control our destiny and continue to age in place, then it may last for years to come.
But does it impact sales?
Here’s how this month’s numbers compare to the full month of April, 2019:
NSDCC Listings and Sales in April
Year
Number of Listings
Number of Detached-Home Sales
2019
494
265
2021
293
268
We have already exceeded the number of sales for all of April, 2019 with a few days left to go!
These are the optimal frenzy ingredients of all-time!
If we do see more homes coming on the market, they should all get gobbled up and cause even crazier market conditions as buyers could have a new listing to consider every week, instead of every month. It might even put a dent in the pricing trend that has been going straight up:
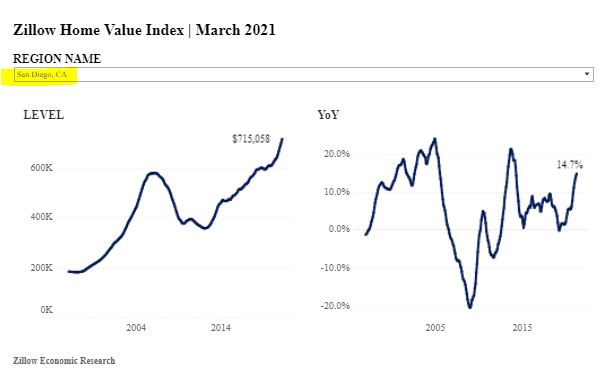
San Diego had positive gains straight through the Covid-19 era:
San Diego Non-Seasonally-Adjusted CSI changes
Observation Month
SD CSI
M-o-M chg
Y-o-Y chg
January ’19
251.30
-0.2%
+1.3%
Feb
253.69
+0.9%
+1.1%
Mar
256.40
+1.1%
+1.2%
Apr
257.63
+0.5%
+0.8%
May
260.08
+1.0%
+1.1%
June
261.90
+0.7%
+1.3%
July
263.66
+0.7%
+2.0%
Aug
263.23
-0.2%
+2.3%
Sep
263.26
0%
+2.8%
Oct
262.56
-0.2%
+2.7%
Nov
263.18
+0.2%
+3.9%
Dec
263.51
+0.1%
+4.7%
Jan ’20
264.04
+0.2%
+5.1%
Feb
265.34
+0.5%
+4.6%
Mar
269.63
+1.6%
+5.2%
Apr
272.48
+1.1%
+5.8%
May
273.51
+0.4%
+5.2%
June
274.91
+0.5%
+5.0%
July
278.00
+1.1%
+5.4%
Aug
283.06
+1.8%
+7.6%
Sep
288.11
+1.8%
+9.4%
Oct
292.85
+1.6%
+11.5%
Nov
295.64
+1.0%
+12.3%
Dec
297.52
+0.6%
+13.0%
Jan ’21
301.72
+1.4%
+14.3%
Feb
310.62
+2.9%
+17.1%
The index should continue to rise more than 2% month-over-month over the next few readings.
Wifey did this for me because I left this morning before the new number was released. We’re heading for more than 20% appreciation this year! San Diego jumped into the #2 slot for the whole country too! From cnbc:
The cities with the largest gains continue to be Phoenix, San Diego and Seattle. Prices in Phoenix gained 17.4% year over year, followed by San Diego with a 17% increase and Seattle with a 15.4% increase. Nineteen of the 20 cities reported stronger price gains in the year ended February 2021 versus the year ended January.
Even as vaccines are distributed more widely and Americans start to emerge back into the economy, the desire for larger living spaces with more outdoor amenities appears not to be waning.
“This demand may represent buyers who accelerated purchases that would have happened anyway over the next several years,” said Lazzara. “Alternatively, there may have been a secular change in preferences, leading to a permanent shift in the demand curve for housing. Future data will be required to analyze this question.”
Two weeks ago we hit a slight dip attributed to the spring break, and the pendings have roared back:
Three Weeks Ago:
Actives: 334
Pendings: 362
Two Weeks Ago:
Actives: 357
Pendings: 344
One Week Ago:
Actives: 335
Pendings: 358
This Week:
Actives: 342
Pendings: 362
While the +20 pendings over actives is impressive, the 362 is far from an all-time high. The total number of pendings was in the 400s between June 22nd and Nov 30th, with the high being 491 on September 7th.
These average $$/sf are touching new highs though, and the sellers will keep pushing:
NSDCC Detached-Home Active Listings
Price Range
# NSDCC Active Listings
Average LP/sf
# Sold Last 60 Days
Average SP/sf
$0-$1.0M
8
$604/sf
27
$561/sf
$1.0M – $1.5M
33
$688/sf
132
$594/sf
$1.5 – $2.0M
43
$693/sf
151
$639/sf
$2.0M – $3.0M
51
$1,005/sf
118
$747/sf
$3.0M+
212
$1,419/sf
107
$943/sf
If you can buy a house between La Jolla and Carlsbad for less than $600/sf today, you’re doing pretty good!
This has a Del Mar address but Sun Valley is east of the 5 and feels more like Rancho Santa Fe, its neighbor down the street here. This sold for $2,675,000 last June, which seems like a relative bargain today: