Nearly 80% of those homeowners with a mortgage are spending less than 35% of their income on housing costs? That sounds like a solid, secure market. Renters should talk to their parents or grandparents about early distribution of their estate:
American homeowners aren’t feeling the pinch from housing costs like they used to — but that’s not necessarily reason to celebrate.
Only 20.9% of homeowners with a mortgage were cost-burdened as of 2018, meaning that they spent at least 35% of their monthly household income on housing costs, according to new data from the U.S. Census Bureau’s American Community Survey. That’s down from 28.8% a decade earlier, just as the financial crisis was reaching its fever point.
And the number of cities where a significant share of homeowners are cost-burdened has dwindled. In 2008, at least 40% of homeowners with a mortgage were burdened across 43 metro areas nationwide. Today, there are no cities where that’s the case.
While homeowners may be less burdened by housing costs, fewer people actually own their homes. Ten years ago, the home-ownership rate was 67.9%, but now it’s 64.8%.
Many of those people who are no longer homeowners have been pushed into the rental market. The country’s rental population has also grown to its largest size ever for as rising home prices and student-loan debt have forced young adults to delay homeownership.
And housing costs remain a major burden for renters, unlike homeowners. The Census Bureau estimated that 40.6% of renters spent 35% or more of their monthly household income on rent and utility bills in 2018. That’s roughly the same share of people as in 2008 (40.8%), but represents more people due to the growth of the country’s rental population.
Households that are forced to pay so much on rent have a harder time saving money to put towards the down payment for a home purchase, making it more difficult to make the transition from renter to homeowner.
Denise B. said to Donna, “What’s happened to your Instagram?”
We have hired a company to produce Instagram content. Kayla used to be in charge, but after she moved to NYC it was left up to me to find a way to create the Instagram posts, and it just never became a big priority.
But it is now.
I was on the calls and knew that this company would be using my content generously for their posts on our Instagram. I’m paying them……to use my content…..to create my posts.
They add all the hashtags and make them look spiffy, so the likes and followers started improving as soon as they took over this month.
But seeing another company producing my content just fired me up – and now I’m inputting as many Instagram posts as they are!
If Instagram is your thing, check us out – I promise you’ll get your money’s worth:
One year after Amazon selected Arlington, Va., as the site of its new HQ2, the impact on the housing market has been pronounced. Massive inventory shortages, sky-high price spikes and a blistering pace of sales are now the norm in the metro surrounding Amazon’s second headquarters, propelling it to one of the nation’s hottest housing markets, according to research by realtor.com.
In contrast, New York City, which was initially chosen as one of the two markets for Amazon’s headquarters, is now sitting at a 15 percent decline in home sales, year-over-year. At the time of the announcement, Manhattan saw a massive leap in home sales of 50 percent. Sales in Manhattan maintained strong double-digit growth until February, when Amazon decided to pull out of New York. At that point, sales growth immediately decelerated and then started declining. The median sale price in Manhattan currently sits at $1.04 million, down 15 percent year-over-year.
“The ‘Amazon effect’ has branched out of its home base of Seattle and it has clearly stamped its fingerprint on the Northern Virginia housing market. The impact of the company’s expansion in the suburbs of Washington, D.C. diverges along homeownership lines, with homeowners experiencing noticeable equity gains and buyers feeling the sting of higher prices,” according to George Ratiu, senior economist at realtor.com®. “Following Amazon’s initial announcement that it was scouting cities for a second headquarters, we knew the winner would see a considerable jump in demand for housing, especially from investors and speculators looking to cash in on increased demand. Looking back a year after the announcement, we can see how dramatic the move has been in the market.”
Immediately following last year’s announcement, home sales in Arlington jumped 21 percent year-over-year as investors swarmed in on the area. Initially, the area saw a substantial 17 percent increase in median listing price, but it has only gone up from there. The median listing price in Arlington County reached $863,000 in October 2019, up 33 percent year-over-year.
In part, the massive price appreciation is due to the lack of inventory and swelling demand for housing in the area. As of October 2019, active listings in Arlington County were down 49 percent year-over-year. Without inventory available to meet current demand, buyers are extending their home search farther out. In Northern Virginia, which is made up of 14 counties, active listings are down 26 percent year-over-year.
The lack of available homes has all but assured that any home hitting the market is bought almost instantly. Half of all homes in Arlington are selling in under 28 days — nine days faster than a year ago and 38 days faster than the national median days on market. The market conditions which have catapulted Northern Virginia into one of the nation’s most competitive housing markets can be traced back to two story lines, according to Ratiu.
“First, the nationwide competition drew so much attention, it caused a massive shortage of homes as investors descended on the area, buying homes as quickly as they could. Second, homeowners and investors have been holding out on selling, anticipating that prices will only continue to increase further, which has compounded the area’s inventory shortage, and further increased home prices, testing the area’s limits for what buyers are willing to pay,” he said.
We are moving less – is it because we won’t, or can’t?
WASHINGTON — Americans are moving at the lowest rate since the government started keeping track, according to Census Bureau data released on Wednesday, as deep changes in the economy and the housing market increasingly freeze Americans in place.
The United States has long been one of the most mobile countries in the developed world. In the 1950s, about one-fifth of the American population moved each year. When factories would close, workers would move to other parts of the country to find jobs in new ones. Young people flocked to cities and rapidly growing suburbs, where jobs were plentiful and rent was cheap.
“In 1957 you could move to a flophouse in New York just to try it out for a while,” said Tyler Cowen, a professor of economics at George Mason University and author of “The Complacent Class: The Self-Defeating Quest for the American Dream.” “That doesn’t exist any more.”
These days, rents in many larger cities have exploded, making it much harder for a young person seeking better opportunities to afford to move. And low-wage jobs, after adjusting for the local cost of living, pay about the same everywhere.
The result is a nation where people move far less than they used to: Just 9.8 percent of Americans moved in the year ending in March, according to the newly released data. That was the smallest share since the Census Bureau started tracking it in 1947, and the first time it had fallen below 10 percent, said William Frey, senior demographer at the Brookings Institution.
“I keep thinking, ‘This is the year we’ll see a bit of an uptick,’ and it just doesn’t happen,” Mr. Frey said. He noted that the share of Americans who move each year now is about half of what it was in the 1950s.
Here’s an example of what you can buy for less than $1,000,000 if you don’t mind going a little further out – a remodeled one-story 3,000sf house with pool and privacy:
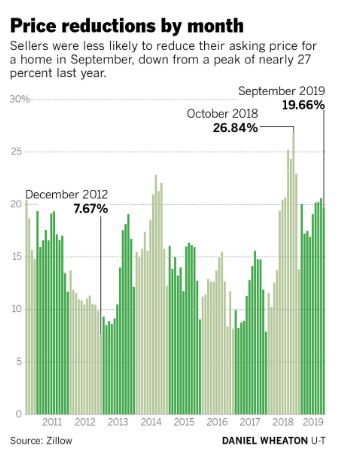
Another indicator that the local market is holding up and sellers aren’t desperate – an excerpt:
Nahjla Wehbe Dipp, a Pacific Sotheby’s International Realty agent, said buyers seem more receptive to not overpricing their homes than a year ago. She said another reason sellers might not want to reduce their asking price could be declining numbers of homes for sale.
Home inventory increased as sales started to slow last year around August, but any extra houses on the market seem to have already sold. There were 6,491 homes for sale in September, said the Greater San Diego Association of Realtors, down from 7,824 at the same time last year.
“There’s just less for buyers to pick from,” Dipp said.
The number of price reductions in a given month can correlate with a hot market. For instance, in San Diego County just 12.1 percent of listed homes had a reduction in 2016, and an average of 11.6 percent in 2017.
Even when a market is red hot, there are reductions. A selling tactic, not usually recommended by most real estate agents, is to price a home higher and then come down so the buyer feels like they are getting a deal.
San Diego still had the most reductions of any of California’s large home markets. Riverside metro area had 16.5 percent of homes with a price reduction in September, followed by 16 percent in Los Angeles and 15.3 percent in San Francisco.
The median home price in San Diego County in September was $570,000, said CoreLogic data provided by DQNews, down from $575,000 at the same time last year.
The thing I think you miss most or maybe overlook is how overleveraged the average person is. I do commercial real estate and routinely have access to small business owners financials. Equity rich in their homes but cash poor with credit card debt and car loans up the wazoo. Any bump in the road will send them into disarray. Selling the house may be the only way they can survive. I think rocky times ahead.
We can speculate about what might be or what could happen, but in the end we’re all just guessing. Blog reader ‘Another Investor’ believes the opposite – that boomers are flush and not moving until they go feet first…..so we have balance here at bubbleinfo.com!
Let’s use statistics to help guide us.
If there were trouble brewing, then more people would be trying to sell.
Not everyone would sell, because their motivation might not be strong enough to take what the market would bear. So let’s just consider the number of listings – and also consider that there are probably more re-lists now than ever:
NSDCC Total Number of Listings Between Jan-Oct:
Year
# of Listings
2014
4,278
2015
4,583
2016
4,698
2017
4,248
2018
4,389
2019
4,327
Boomers or others aren’t trying to sell any more than they used to – so no obvious surge yet.
But the number of cash-out refinances was somewhat alarming yesterday. But everyone has to qualify for those mortgages, so even if more people are tapping their equity, they must be able to afford it.
But like Eddie89 said, the rules have changed, so all previous assumptions don’t apply.
I think any distressed homeowners will wait until the very end before deciding to sell because they really don’t want to move. It will drag out the inevitable, but it might just cause a softer landing because each homeowners ability to last longer will vary.
Let’s keep an eye on the number of new listings – that’s where you’ll see it first!
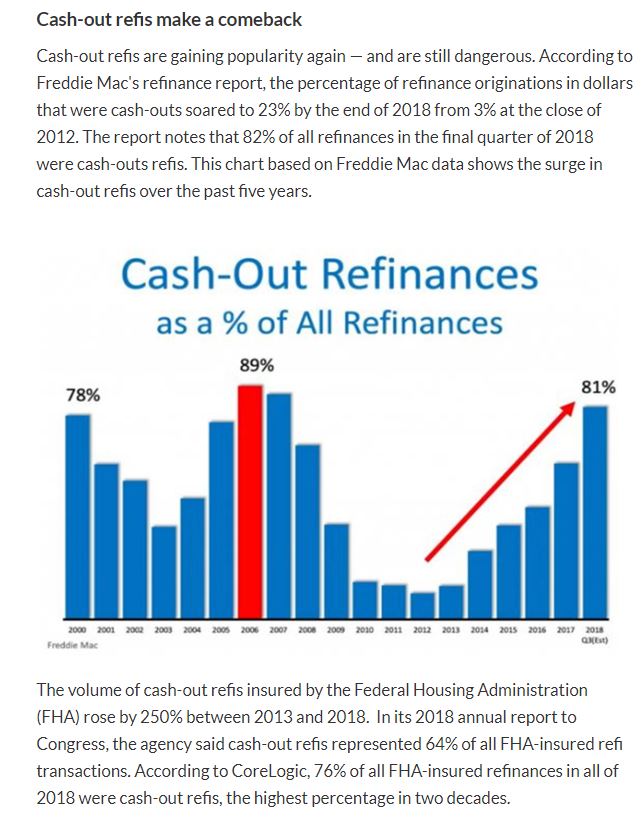
Low mortgage rates and large down payments are how buyers today are able to afford these lofty prices. Wondering where the big money comes from? Some of it could be from cash-out refinances:
The article has a couple of other zingers too – excerpts:
In recent years, wealthy homeowners have gotten into the cash-out refi game in a big way. A CoreLogic report in January 2019 found 230 active giant refinanced mortgages between $10 million and $20 million — most originated since 2013. Almost half of these loans were identified as cash-out refis. The average amount of cash pulled out was $6.6 million. Last year, the average had risen to $8.3 million.
Almost 10 million cash-out refis were originated during the wildest bubble years of 2004–07. While a significant number of them have been foreclosed, most still have not. As I noted in a previous column, mortgage servicers nationwide have been extremely reluctant to foreclose on long-term deadbeats since 2012.
Another column earlier this year laid out the enormous problem of modified mortgages that have re-defaulted one or more times. Close to two-thirds of all sub-prime bubble era mortgages had already been modified by 2015. The re-default disaster was so great that by mid-2010 there were more subprime modified mortgages re-defaulting than there were delinquent loans being foreclosed and liquidated by mortgage servicers.
The author is probably the biggest doomer on the beat. He called me once and insisted that I agree with him on his gloomy predictions, and when I wouldn’t, he hung up on me. But his articles here are a good reminder – whatever happened to those loan modifications?