
Our local San Diego Case-Shiller Index sure has settled down. In the last five months, the index has only risen 0.8%.
The index is so flat it seems suspicious.
It is a three-month weighted average, but that also means a whole new set of home sales are added every month – yet the index is virtually identical for five months running? It used to bounce around more.
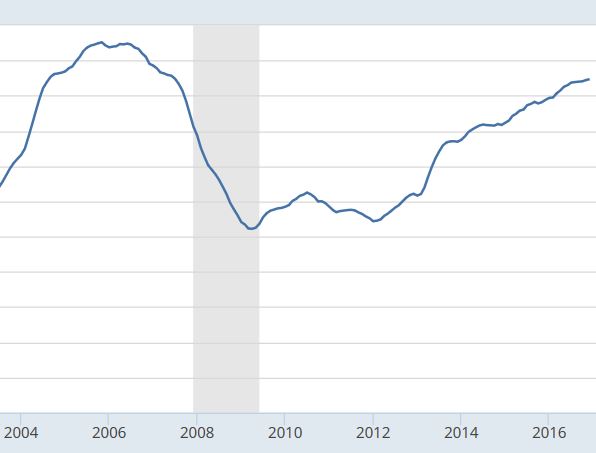
Our index has gone up 59% since the recent bottom in April, 2009.
San Diego Non-Seasonally-Adjusted CSI changes:
| Month | |||
| December | |||
| January ’15 | |||
| February | |||
| March | |||
| April | |||
| May | |||
| June | |||
| July | |||
| August | |||
| September | |||
| October | |||
| November | |||
| December | |||
| January ’16 | |||
| February | |||
| March | |||
| April | |||
| May | |||
| June | |||
| July | |||
| August | |||
| September | |||
| October | |||
| November | |||
| December |
The highest reading of the San Diego NSA CSI was 250.34 in November, 2005.


