by Jim the Realtor | Aug 17, 2021 | 2021, Frenzy, Market Conditions, Showings, Slowdown
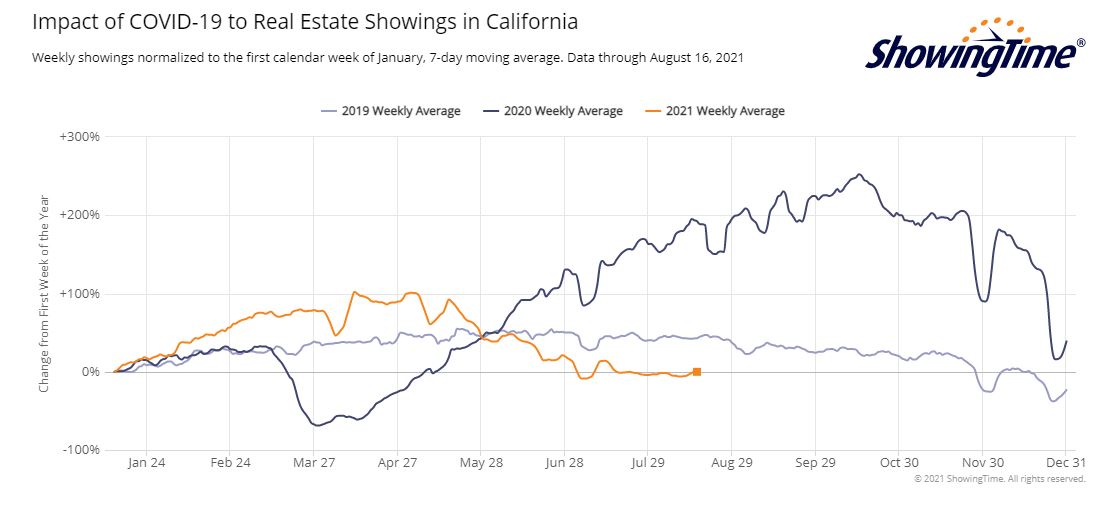
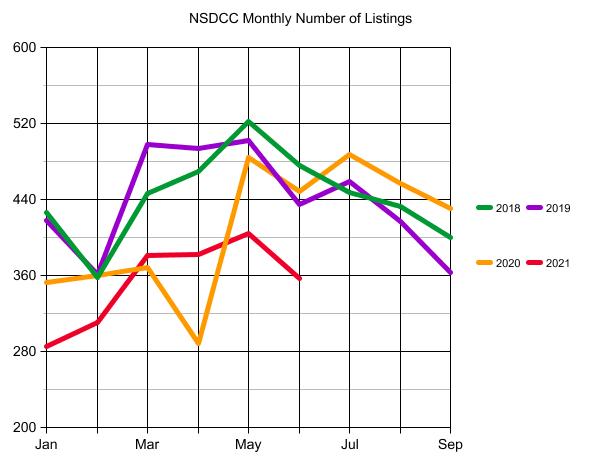
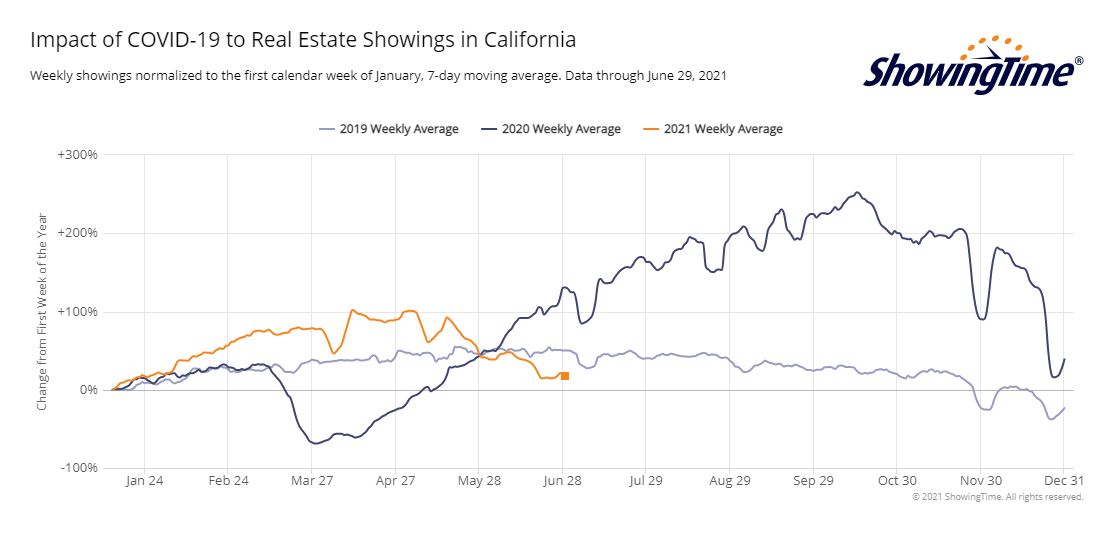
It’s one thing to note that showings are well under the peak frenzy era of August-November. But today’s showings are also well below what they were in July 2019, which was a fairly flat market then.
Is the demand falling apart?
Or is it due to lower inventory?
Let’s compare the inventory counts for middle of August.
NSDCC Number of Homes For Sale
| Price Range |
August 19, 2019 |
August 17, 2020 |
August 16, 2021 |
| $0-$1.0M |
103 |
28 |
2 |
| $1.0M-$1.5M |
179 |
113 |
48 |
| $1.5M-$2.0M |
199 |
123 |
56 |
| $2.0M-$3.0M |
543* |
137 |
69 |
| $3.0M+ |
– |
294 |
200 |
| Totals |
1,024 |
695 |
375 |
*In 2019 the highest category was Over-$2,000,000 – the categories were split the next year.
The total counts are distinctly different.
In 2019, the market was sluggish, and the local Case-Shiller went flat for the last six months. There were too many homes for sale.
Last year, the increased demand was met with a much tighter supply than in 2019, but looking back we can say it was the optimal amount of homes for sale in order to create the red-hot frenzy!
Now, there aren’t enough homes for sale to keep the momentum going, and the frenzy is being starved out.
by Jim the Realtor | Jul 16, 2021 | Frenzy, Frenzy Monitor, Slowdown

“We’re starting to see what a difference just a slight uptick in inventory and listings can do to help lessen the buying frenzy and create a sense of normalcy,” said C.A.R. President Dave Walsh (California).
~~~~~~~~~~~~~~~~~~~~~~~~~~~~~~~~~~~~~
by Jim the Realtor | Jul 14, 2021 | Frenzy Monitor, Slowdown, Spring Kick
When comparing to the last reading there hasn’t been much change, but the May 12th numbers were quite different – the number of actives today is now 15% higher, and pendings are 16% lower.
But it had to go in that direction. The March-May period has to be the hottest stretch ever recorded:
NSDCC Actives and Pendings
| Town or Area |
Zip Code |
Feb 2nd |
May 12 |
May 26 |
Jun 9 |
Jun 23 |
Jul 14 |
| Cardiff |
92007 |
11/16 |
9/12 |
10/11 |
8/14 |
10/11 |
14/7 |
| Carlsbad NW |
92008 |
17/19 |
19/30 |
19/23 |
20/24 |
21/23 |
18/24 |
| Carlsbad SE |
92009 |
9/38 |
19/60 |
13/57 |
19/49 |
21/44 |
27/42 |
| Carlsbad NE |
92010 |
1/12 |
5/13 |
6/13 |
8/14 |
7/15 |
8/19 |
| Carlsbad SW |
92011 |
2/17 |
8/16 |
4/17 |
4/19 |
11/16 |
12/24 |
| Carmel Valley |
92130 |
26/43 |
20/65 |
23/63 |
23/65 |
30/65 |
27/60 |
| Del Mar |
92014 |
43/13 |
34/26 |
34/26 |
32/20 |
37/19 |
42/12 |
| Encinitas |
92024 |
39/45 |
33/54 |
32/56 |
33/61 |
36/65 |
42/50 |
| La Jolla |
92037 |
101/46 |
82/40 |
87/47 |
88/48 |
88/41 |
89/38 |
| RSF |
92067 |
96/35 |
83/54 |
72/53 |
80/38 |
79/42 |
72/42 |
| RSF |
92091 |
– |
3/7 |
1/6 |
3/6 |
1/3 |
1/2 |
| Solana Beach |
92075 |
11/10 |
6/9 |
7/8 |
12/6 |
14/10 |
17/12 |
| NSDCC |
All Above |
356/294 |
321/386 |
308/380 |
330/364 |
355/354 |
369/332 |
We can also track the average market times too. Any upward trends here would indicate market slowing:
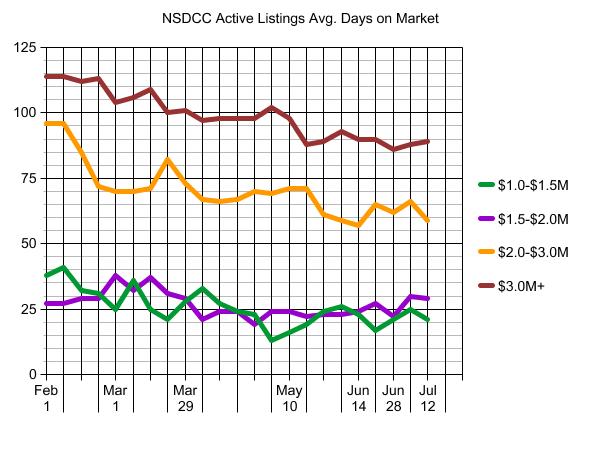
We could get a nice flare-up of activity as the summer closes out, and it probably won’t be that obvious in these stats as the frenzy simmers down slowly over the next few weeks.
by Jim the Realtor | Jul 13, 2021 | 2021, Frenzy, Showings, Slowdown
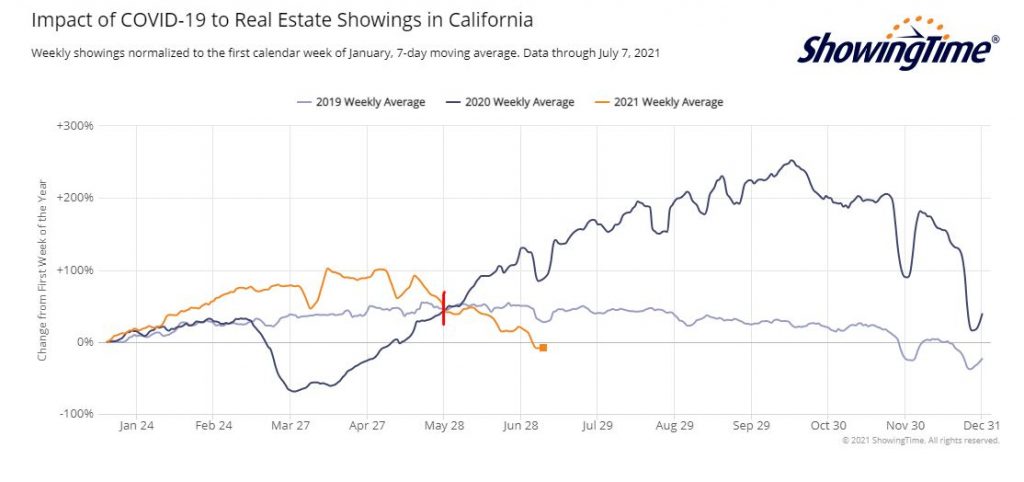
Fewer showings than in the first week of January?
Well, the market was cooking right up to Christmas and then fired up quickly again this year, which created a solid 12-month frenzy.
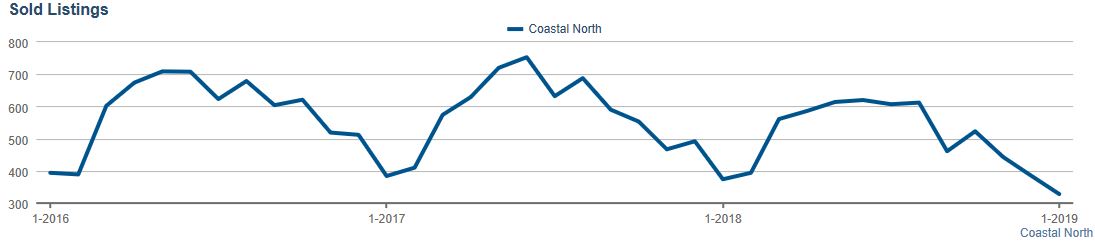
But now there are fewer showings than in 2019 too? How did that turn out?
You can say it was a little flat, price-wise:
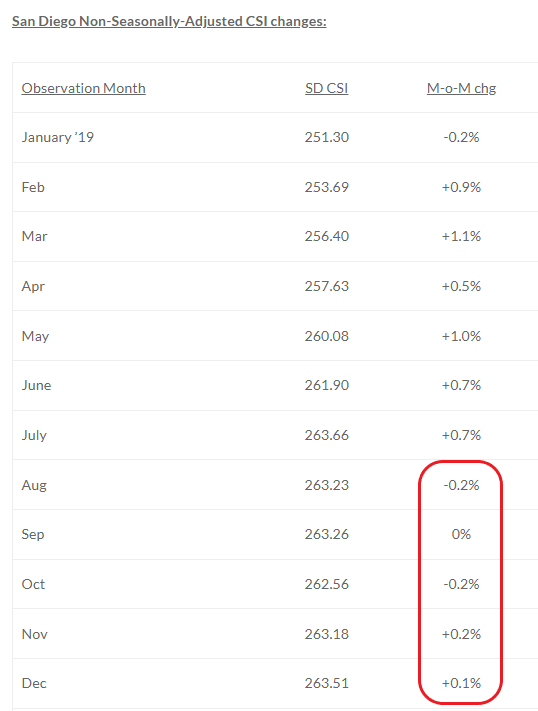
Whether it’s due to ‘seasonality’, higher rates, lower inventory, blah, blah, it doesn’t matter.
The remaining buyers left have to be exhausted – losing bidding war after bidding war takes a toll, and by now people want to give up.
Welcome to Plateau City.
There will still be eye-popping sales, just not as many.
~~~~~~~~~~~~~~~~~~~~~~~~~~~~~~~~~~~~~~~~
Another data point showing the frenzy lift-off in May, 2020
by Jim the Realtor | Jul 12, 2021 | 2021, Frenzy, Jim's Take on the Market, Market Conditions, North County Coastal, Slowdown |

Random thoughts:
Having 130 NSDCC homes in June sell for $100,000+ over list price should be an all-time record. If we had half that many, it would be astonishing!
But those were decisions made in April and May.
It feels like the market is in the deceleration stage, where fewer homes are worthy of a bidding war. Sellers and agents who insist on adding an extra 5% to 10% to their list price will need to be selling an exceptional property AND present it perfectly to generate offers.
The inferior homes/locations (the ones who really benefited during the peak frenzy) will be the ones that feel it the most. The gap between the dogs and the creampuffs will widen.
Listing agents who “have comps”, and around $5, can get a cup of coffee.
Open houses will help with the transparency. Buyers and lookers will be able to experience the upgrades in person, and get a better read on the traffic. The art of determining the difference between lookers and buyers will be renewed.
There will be eye-popping sales.
We will find peace with these higher prices. We would have gotten here eventually – it just happened faster than we ever thought possible.
Higher interest rates won’t have a big impact – there’s too much cash in play to soften the blow. One thing you can count on – sellers won’t care about higher rates. They aren’t in a hurry, they don’t have to sell, and they aren’t going to give it away!
If prices were to come down, it would be slowly and over time. There will be occasional deals that give hope to lower pricing, but then a couple of high sales will happen right behind them.
The ibuyers might be the only candidates who could influence the market in a panic, but they could rent their homes for a while if they had to. They are big corporate entities who are used to losing money, so no real pressure. The old accounting rules REQUIRED banks to sell their properties quickly, but those days are long gone.
More potential sellers will give up the thought of moving, and the number of homes for sale could stay restricted – or even go lower. The hope of there being a post-covid surge of sellers will wane.
If there were an occasional surge of new listings, they would all be priced based on recent sales…..or priced higher. If buyers don’t like today’s prices, having more inventory priced the same won’t help.
The statistics will bounce around more as we pull into Plateau City.
All of the above (except #1) should remind you of how it used to be!
~~~~~~~~~~~~~~~~~~~~~~~~~~~~~~~~~~~~~~~~~
by Jim the Realtor | Jul 2, 2021 | 2021, Forecasts, Frenzy, Jim's Take on the Market, Sales and Price Check, Slowdown |
The Covid Frenzy has had remarkable shift in market efficiency like we have never seen.
Historically, we have had so many listings that 35% to 40% of them didn’t sell.
This year we had 977 listings hit the market in 1Q21, and 80% of them have already closed escrow! Of the remaining listings that haven’t sold, two-thirds of them were cancelled, withdrawn, or expired which usually means that the sellers either changed their mind or refreshed their listings. Of the 977 listings, only 47 of them remain as active (unsold) listings, with a median list price of $6,900,000!
Yet, the extremely active marketplace isn’t causing more people to sell.
The total number of 2021 listings is 8% behind the covid-impacted 2020!
NSDCC Listings and Sales
| Month |
2018 |
2019 |
2020 |
2021 |
2021 L/S |
| Jan |
426/149 |
418/150 |
353/182 |
285/187 |
1.52 |
| Feb |
358/162 |
361/174 |
360/184 |
311/224 |
1.39 |
| Mar |
446/258 |
498/211 |
368/206 |
381/252 |
1.51 |
| Apr |
469/270 |
494/265 |
288/156 |
382/357 |
1.07 |
| May |
522/273 |
502/297 |
484/143 |
404/301 |
1.34 |
| Jun |
476/299 |
435/282 |
448/274 |
357/340 |
1.05 |
| 1H Totals |
2,697/1,411 |
2,708/1,379 |
2,301/1,145 |
2,120/1,661 |
|
| List/Sales |
1.91 |
1.96 |
2.01 |
1.28 |
|
There were 357 new listings last month, and 340 sales?!?! The lack of inventory or the rapidly-rising prices aren’t slowing down sales! If only there were more houses to sell under $2,000,000!
If sales were to retreat, it would seem obvious that it would be due to the lack of supply. There have been more losers of bidding wars than winners, and that demand has yet to be satisfied.
But we are going to hear more doomer talk in the media. Here we have Larry predicting that more homes will be listed in the latter half of 2021 – which would cause MORE sales – yet check the headline:
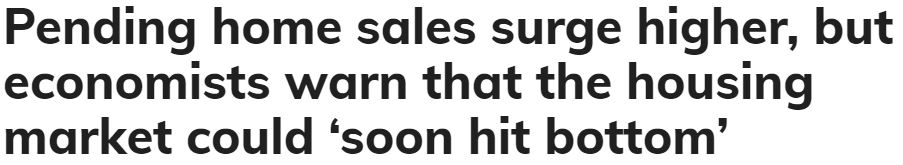
An excerpt:
What happened: All regions saw an uptick in pending sales, led by a 15.5% surge in the Northeast. The South saw the smallest increase, with a 4.9% uptick.
The big picture: The uptick in pending sales could be sustained, Yun argued, because of the strong stock market and rising home prices. He predicted that more homes will be listed in the latter half of the year, which would help to slow the pace of home-price growth.
Still, economists generally anticipate that the second half of 2021 will see a slowdown in real-estate transactions. To get an idea of where home sales are headed, look no further than the data for mortgage applications.
“Sales lag mortgage applications, and the 26% plunge in the latter between December and April is now working its way through the sales numbers,” Ian Shepherdson, chief economist at Pantheon Macroeconomics, wrote in a research note. He went on to argue that “sales will soon hit bottom, given the flattening in mortgage demand over the past couple months.”
The latest mortgage-applications data from the Mortgage Bankers Association would back up that prediction. The trade group’s index that measures the volume of applications for loans used to purchase homes was down 17% from a year ago as of the week ending June 25, and had declined 6% from the previous week.
Hit bottom? Bottom of what?
The ‘26% plunge’ in mortgage applications between December and April didn’t slow sales – they are higher in every market. But determined to find some doom, he surmises that the lower number of purchase applications will catch up to sales some day?
It doesn’t occur to the ivory-tower types that the market was going ballistic last summer, and this week’s mortgage apps being 17% lower than last year is not alarming. We had 350 NSDCC sales last August, and another 361 sales in September – both record highs!
Yet the media publishes this garbage without a thought. They could unwittingly cause a slowdown just when more homes might be coming to market – which would goose sales higher, not lower.
by Jim the Realtor | Jul 1, 2021 | Jim's Take on the Market, Showings, Slowdown |
There is a collective mindset.
For the last year, real estate has been hot around the world. When California gets cooking, so do all the neighboring states. And when America gets cooking, other markets around the world benefit too.
There are varying degrees of hot, but we can say that real estate markets everywhere have been operating at their peak capacity.
We’ve had a year of full-tilt frenzy and sales were SPECTACULAR!
But yesterday we got the first headline from Doomer Diana that should be a marker:
Thankfully, not many people will read her article where she states that higher prices and rates are the cause of the ‘fizzle’, which is a knee-jerk reaction. She and others will blame the buyers for any slowdown.
Good thing she didn’t see the the graph at the top that has showings lower than in June, 2019, and you remember how that ended (the San Diego Case-Shiller flat-lined for the second half of 2019).
It will be common to blame the buyers. But for the first time ever, our real estate market is having a critical shortage of homes for sale when the demand is exceedingly high. There were 500 people who visited a $1,700,000 Carmel Valley house over the weekend. Demand is not our problem, it is the lack of supply.
I’ll back it up with some stats shortly.
~~~~~~~~~~~~~~~~~~~~~~~~~~~~~~~~~~~~
by Jim the Realtor | Jul 8, 2019 | Graphs of Market Indicators, Jim's Take on the Market, Sales and Price Check, Slowdown
Double-digit increases can’t last forever – but could home prices plateau for years? It will probably depend on mortgage rates, and having enough reasonable sellers who are willing to take the same $ as what the last guy got.
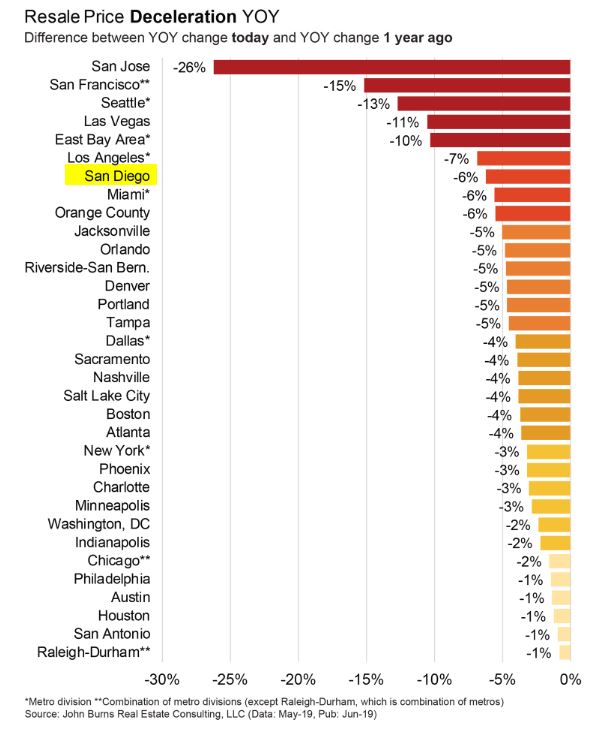
From our friends at JBREC:
Price appreciation has slowed across every major housing market, in what we are coining the Great Price Deceleration.
The biggest deceleration occurred in San Jose: Last year, resale prices in San Jose were up 20% YOY! Today, prices are down 6% YOY—a deceleration of 26%. Last year, San Jose was frenzied with less than one month of supply and very strong job growth. Builders were selling homes faster than they could build them. In the second half of 2018, the San Jose market slowed substantially due to affordability issues, but conditions have stabilized this year.
Top California markets, Seattle, and Las Vegas have experienced the most price deceleration. Home buyer affordability remains weak, even with historically low 4% mortgage rates, and homes are sitting on the market longer (especially higher-priced homes). We are seeing more buyer demand in markets such as Seattle, where home builders have adjusted prices.
Markets in the Southeast, Midwest, and Northeast have been far less frenzied this cycle and have had much steadier prices. These markets are typically lower risk in their fundamentals (more affordable, less risk of oversupply, and steady job growth). Raleigh-Durham has experienced the least deceleration in price from last year. Resale prices gained 7% YOY last year, and today they are up 6%, a 1% price deceleration.
Nationally, we expect resale prices to gain 2% through 2022, cumulatively, but there are huge disparities by region and metro.
We explore all top housing markets each month in our Regional Analysis and Forecast report for our paying research clients. If you are interested in becoming a research client, please reach out to our team of expert analysts.
https://www.realestateconsulting.com/
by Jim the Realtor | Jul 7, 2019 | Forecasts, Jim's Take on the Market, Market Conditions, Slowdown |
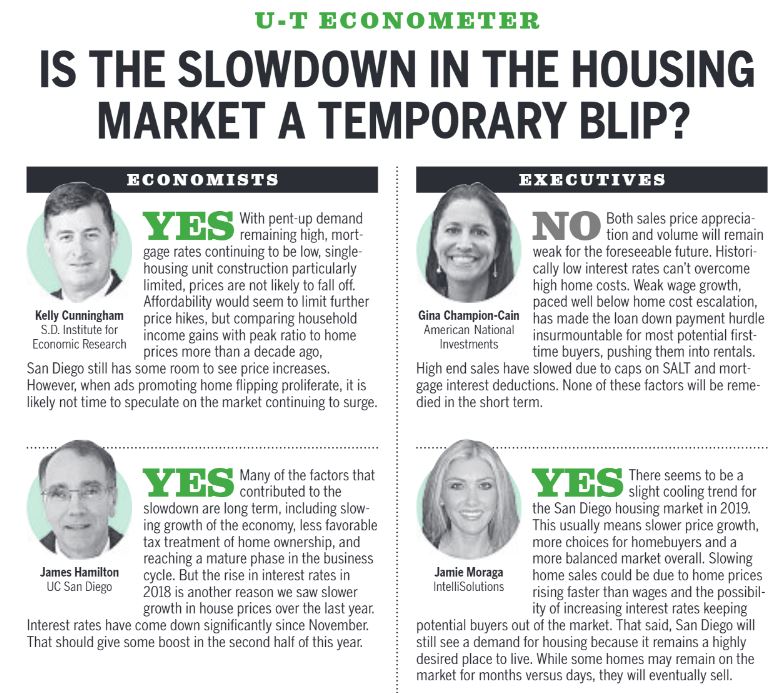
This collection of opinions has more reach – and more influence – than those of any part-time blogger. Thankfully, these experts are split on whether the alleged slowdown is temporary, so readers will just be on their merry way in hopes that it will all work out.
It’s what happens when the ivory-tower group chimes in – they attempt to apply the vague old theories to what is happening today, but we don’t know if their principles are still valid.
Gina is the only one who mentioned a specific data point, so let’s put the actual number on it:
First-half sales of detached-homes in San Diego County between $1,000,000 and $2,000,000 were nearly identical year-over-year (1,551 in 2018, and 1,546 in 2019), while sales over $2,000,000 dropped 10% YoY.
Gary probably has the best take on it above, and his day-to-day focus is advising builders.
My thought:
We have a low supply of quality homes mixed with a very affluent demand which is causing every aspect of selling homes via the MLS to be under attack. Rather than championing (and improving) the traditional system of selling homes, the industry is going to allow off-market sales, ibuyers, commission lawsuits, and Wall Street to sway the outcome.
It will take away some of the free-market influence, which could keep us at an artificially-inflated plateau.
But then again, I’ll stick with what Yogi Berra said,
“It’s tough to make predictions, especially about the future.”
Link to UT Article
by Jim the Realtor | Feb 5, 2019 | Jim's Take on the Market, North County Coastal, Slowdown, Spring Kick |
We saw yesterday that we had 5% fewer January listings year-over-year, giving the impression that sellers aren’t rushing their homes to market.
But we came into 2019 with more leftover listings from last year – and they are already starting to pile up:
NSDCC Detached-Homes
| Year |
January Sales |
Active Listings, First Week of February |
| 2016 |
171 |
821 |
| 2017 |
175 |
774 |
| 2018 |
150 |
652 |
| 2019 |
145 |
774 |
Last year we were overdue for some slowdown, but were able to survive lower January sales because the inventory heading into the selling season was so thin that urgency was higher among buyers, which kept the party going.
This year we had fewer sales even with higher inventory, which means the selling-success rate is dropping steadily. Once more unsold listings start stacking up, the urgency among buyers will diminish.
This is the same data as yesterday, but over three years instead of five, and shows how the 2018 selling season didn’t pop like in previous years:
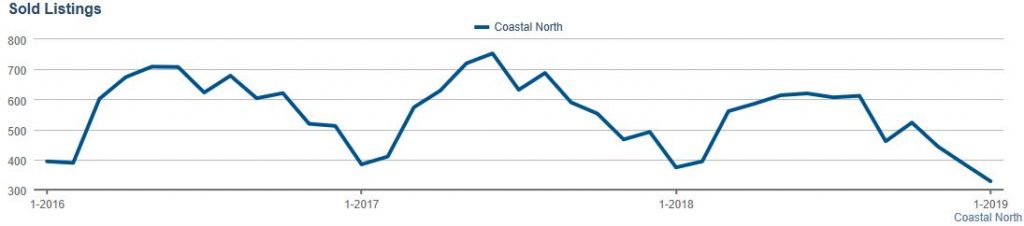
Click to enlarge
Mortgage rates went over 4.5% in May which helped to discourage sales, but you can see how the initial surge barely got past March. Even if rates stay where they are today, we could have a muted sales season just because we are already loaded with listings.