by Jim the Realtor | Nov 30, 2023 | Jim's Take on the Market, Sales and Price Check |
The market is so much different now than it used to be that we should jettison all previous assumptions (paraphrased from a Rob Dawg comment years ago).
In the old days, prices would be coming down by now because the demand would have been severely impacted by higher prices and rates – but not today:
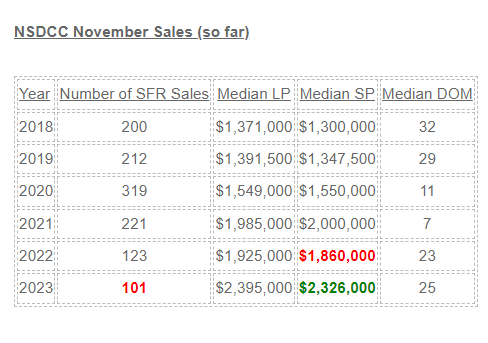
Is it just early? Maybe, but are sellers going to dump on price when there’s always next year? With virtually no foreclosures and unemployment, there aren’t the usual pressures on sellers, and most will wait it out, rather than lower their price in a panic.
The real impact will be on the number of sales. We’ve already experienced – and survived – around 100 sales per month in the off season, and if that happened every month of the year, we’d find a way to live with that too.
Sellers need to choose – do more to spruce up the house for sale, or be willing to take less. If the house is already dated and needing a full renovation, the discount will probably be getting larger, because buyers are putting up a fight.
Here are examples of the November discounts – only one sold over list:
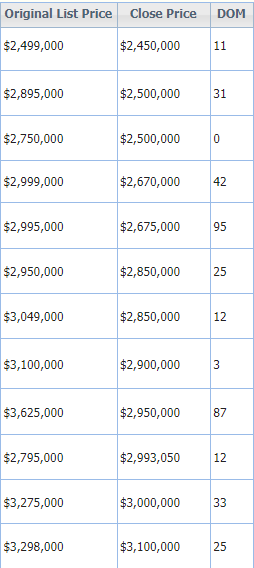
The median sales price could levitate, or even rise, while more discounts off the aspirational list prices keep happening!
by Jim the Realtor | Nov 19, 2023 | Market Buzz, Sales and Price Check |
by Jim the Realtor | Nov 15, 2023 | Market Buzz, North County Coastal, Sales and Price Check
A columnist reflected on history to help measure whether it’s a seller’s market, or a buyer’s market. I like it!
House-hunting’s transformation includes several market trends including people moving less often, consumers accessing detailed market info, near-instant cash buyers and tighter lending standards. Maybe the buyer/seller-market math should morph, too.
From 1990 through 2006, just before the bubble burst, California was a “buyer’s market” in 49 percent of all months and a “seller’s market” 17 percent of the time — using the traditional 6-month/3-month template and Realtor data.
Looking at the past 12 post-crash years — assuming you’d want to match that pattern — a buyer’s market would be 3.25 months-plus of supply and a seller’s market would be 2.25 months or less.
This evolving gap in homebuying supply is another reminder of today’s steep house-hunting challenges.
Link to the Full Article with data
Currently there are 359 active detached-home listings between La Jolla and Carlsbad, and last month there were 140 sales. The 359/140 = 2.56, which, by the new definition, is pretty close to a seller’s market!
by Jim the Realtor | Nov 10, 2023 | Market Conditions, Sales and Price Check
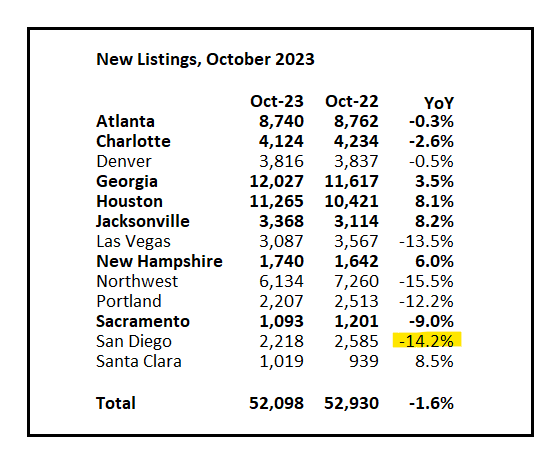
Having 2,218 new detached and attached listings in a county of 3.3 million people is anemic. There were 4,198 new listings in October, 2019.
But it doesn’t look like we need any more – those on the market aren’t selling like before. In fact, the unsolds are starting to stack up now, which is the #1 fear for sellers:
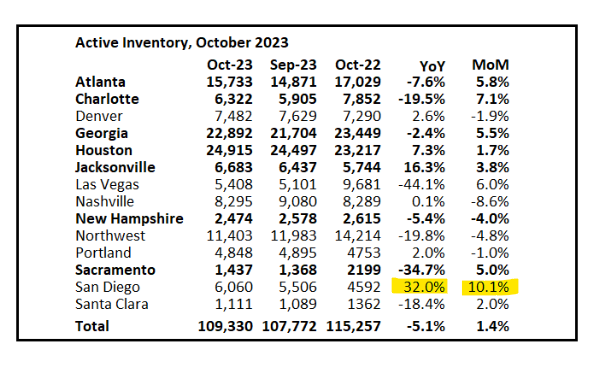
It’s showing here too:
These are the more typical market pressures we would see in a normalizing market. The sellers are losing some of their pricing power, and buyers think that most of the current offerings just aren’t worth it.
by Jim the Realtor | Nov 1, 2023 | Sales and Price Check
They update the previous month’s stats on the first of month, so here’s the latest for Carmel Valley, Carlsbad, and Encinitas:
Encinitas had an crazy price bump in June, but toss that stat out and the pricing looks fairly steady. There just aren’t enough homes for sale that deserve the money. Until sales bottom, having the pricing hold up will be a challenge, especially with sellers enjoying the unnaturally high appreciation rate over the last 3+ years – if they have to give back 5% to 10% to make a deal, it won’t hurt them much.
by Jim the Realtor | Oct 18, 2023 | 2023, Local Flavor, Sales and Price Check |
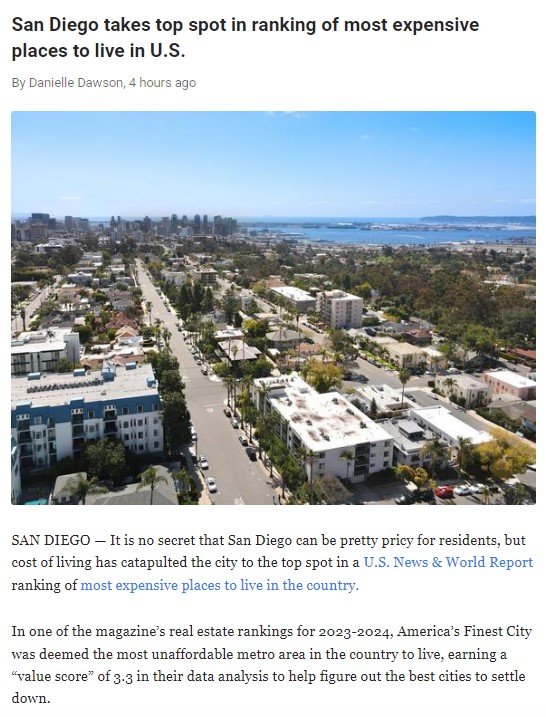
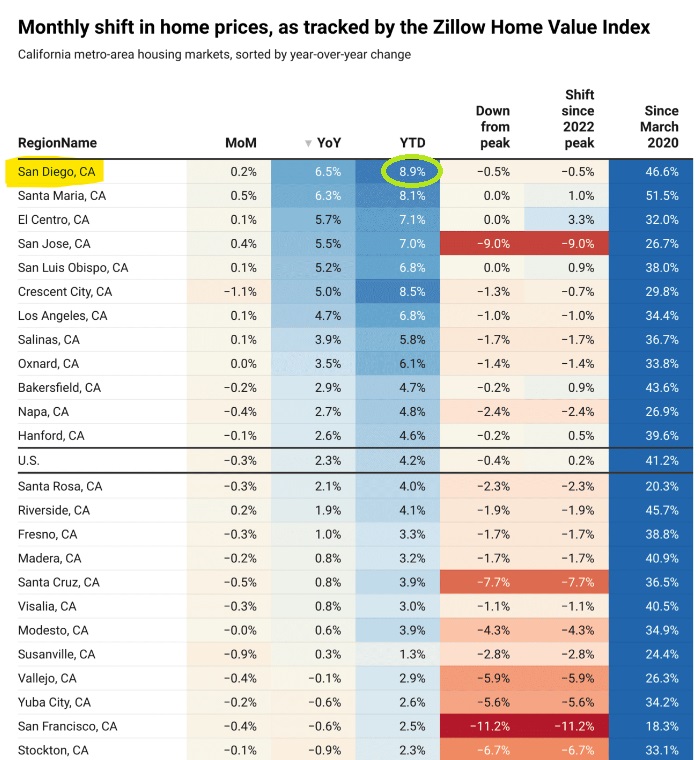
San Diego is #1! Hat tip to Mitch for sending this in:
According to the magazine, the Value Index measures how comfortably the average resident of a metro area can afford to live within their means. Specifically, it looks at housing affordability, as well as federal data on the parity between regional prices and national averages.
Home prices were one of the factors that pushed San Diego up on the ranking, given that average prices are considerably higher than the national rate.
In August, the median price for a single-family home came in right at $1 million for the first time in the region’s history — nearly $650,000 more than the national average by some estimates.
U.S. News and World Report also pointed to additional fees that San Diego residents have to pay, such as homeowners association dues or apartment complex maintenance costs, as another factor driving its unaffordability.
However, the magazine said that many residents are willing to pay elevated prices relating to cost-of-living, given other aspects of the region that make it an ideal place to live.
They added that some San Diegans often refer “to the cost-of-living differences as the ‘sunshine tax,’ or price of enjoying a year-round temperate climate.”
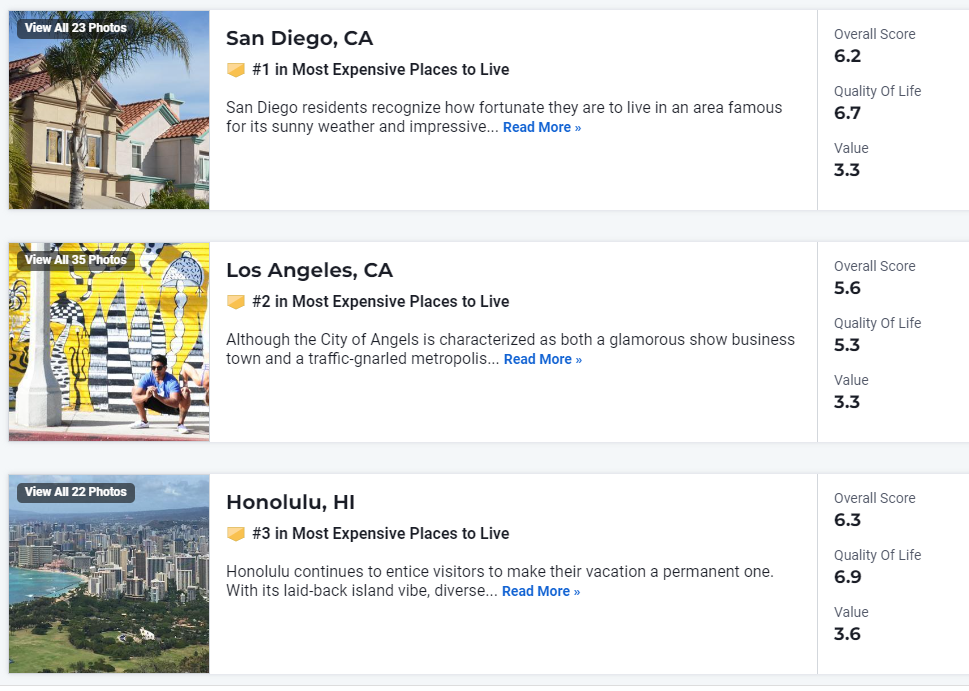
Many of the other metro areas that were placed along the top 10 have similar “sunny” reputations with their climate, including cities Los Angeles, Honolulu, Miami and Santa Barbara.
Los Angeles, which came in second place on the ranking, was also given a score of 3.3 for residents’ ability to afford living there. Although, San Diego’s northern neighbor comparatively had lower scores for other metrics used by the magazine to look at “best places to live,” including the overall and quality of life indexes.
A full list of the top 25 “most expensive places to live” in the U.S. can be found here. San Diego is #1.
This ranking comes as inflation rate nationwide remains to a persistent problem for federal officials, but San Diegans seem to have been feeling it even more.
In San Diego, the U.S. Bureau of Labor Statistics estimated that the city exceeded the year-to-year national rate of inflation, which was around 3.7% in September. Over the last 12 months, prices in the San Diego area advanced about 4.7% overall, according to the bureau.
Housing costs have been one of the most pressing issues facing elected officials, with prices skyrocketing for both buyers and renters due to a continued lack of available units to meet the demand in the region.
https://www.newsbreak.com/news/3196358711262-san-diego-takes-top-spot-in-ranking-of-most-expensive-places-to-live-in-u-s
by Jim the Realtor | Oct 17, 2023 | Sales and Price Check
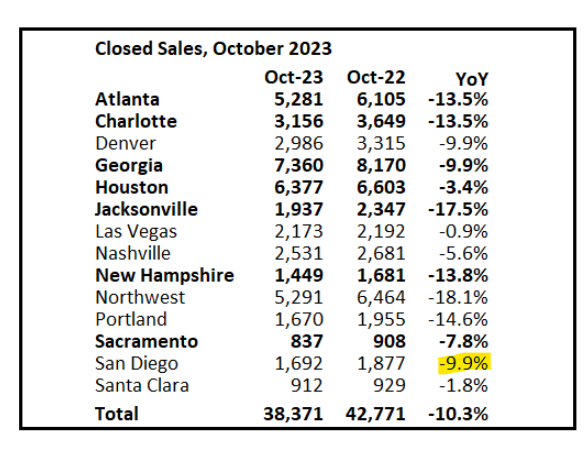
Even as the doom continues to pour in from other areas that aren’t as fortunate as the North San Diego County coastal region, our home sales are defying expectations. Two facts:
- In September, 2022, there were 146 sales with a median sales price of $1,940,000 (16% lower).
- There have already been 66 sales closed this month, and the current MSP is $2,150,000.
Although it would seem like a miracle, having 100+ sales per month in the fourth quarter of 2023 with a median sales price staying above $2,000,000 looks possible.
by Jim the Realtor | Oct 11, 2023 | Sales and Price Check
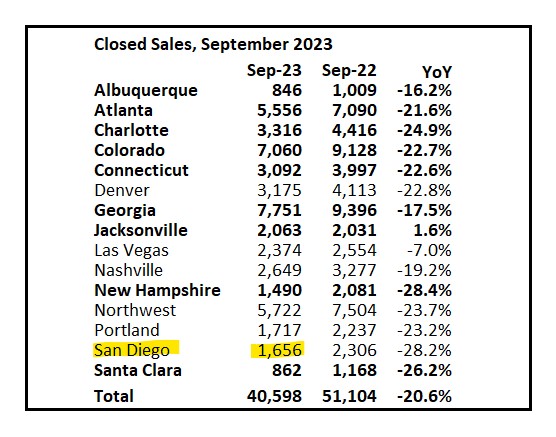
The local sales numbers are frightening. Compare our sales counts to these areas:
Populations / Sales = People Per Sale
New Hampshire: 1,389,000 / 1,490 = 932
Portland metro: 2,220,000 / 1,717 = 1,293
Las Vegas metro: 2,227,000 / 2,374 = 938
Charlotte metro: 2,267,000 / 3,316 = 684
Denver metro: 2,931,000 / 3,175 = 923
San Diego: 3,319,000 / 1,656 = 2,004
Here is how they compare – the high month in 2023 was similar to the annual low month perviously!
Sellers will have to do more than ever to improve their home for sale – just to get in the running!
by Jim the Realtor | Oct 10, 2023 | Sales and Price Check
The following metro areas had year-over-year median home price increases of 10% or more since September 2022:
- Los Angeles: 23.8%
- San Diego: 18.2%
- Richmond: 15%
- Cincinnati, Ohio: 14.6%
- Providence, Rhode Island and Massachusetts: 14.6%
- Boston: 14.1%
- Columbus, Ohio: 12.1%
- Rochester, New York: 11.4%
- Pittsburgh: 10.6%
- Chicago: 10.3%
- Indianapolis: 10%
In almost all of these cities, prices leveled off or decreased in late 2022, only to rise again in 2023, according to Realtor.com data. As is the case nationally, home prices have risen in these places because there are simply not enough homes built to meet demand, says Danielle Hale, chief economist at Realtor.com.
California has a longstanding housing shortage — perhaps the worst in the country — so home price growth in L.A. and San Diego isn’t overly surprising, especially considering price gains in recent years. Median home prices in L.A. and San Diego have increased by 38% and 48% since January 2020, respectively, based on Realtor.com’s active listings data.
Link to Article
by Jim the Realtor | Sep 27, 2023 | Jim's Take on the Market, North County Coastal, Sales and Price Check
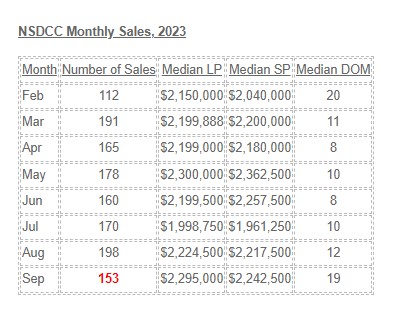
We’re having another amazing month, and should get close to 150 sales!
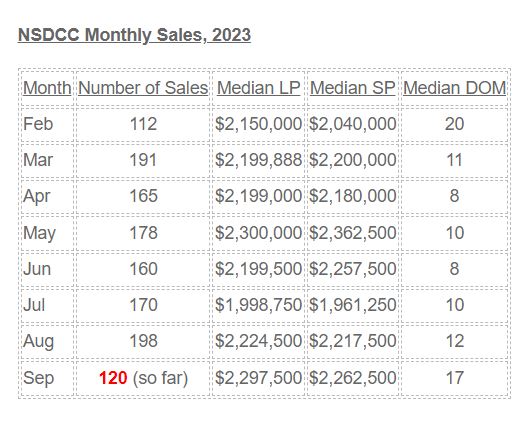
The pricing appears to be holding up nicely too (and more evidence that July’s collection of lower-priced sales was an anomaly).


