by Jim the Realtor | Jan 24, 2023 | 2023, Market Buzz, Market Conditions, NSDCC Pendings |
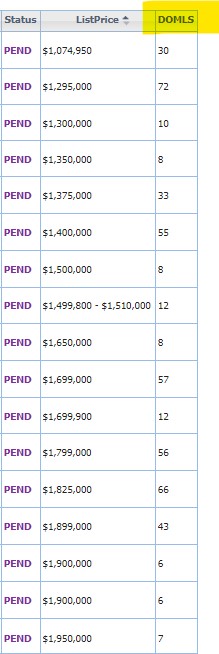
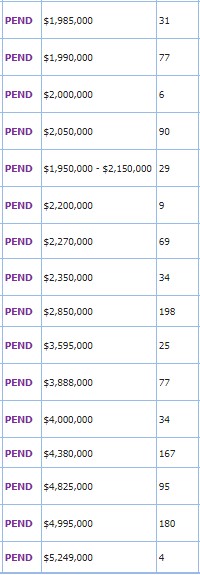
It’s impressive to see so many high-enders go into escrow this quickly – these are the NSDCC homes listed over $4,000,000 than have gone pending since the first of the year:
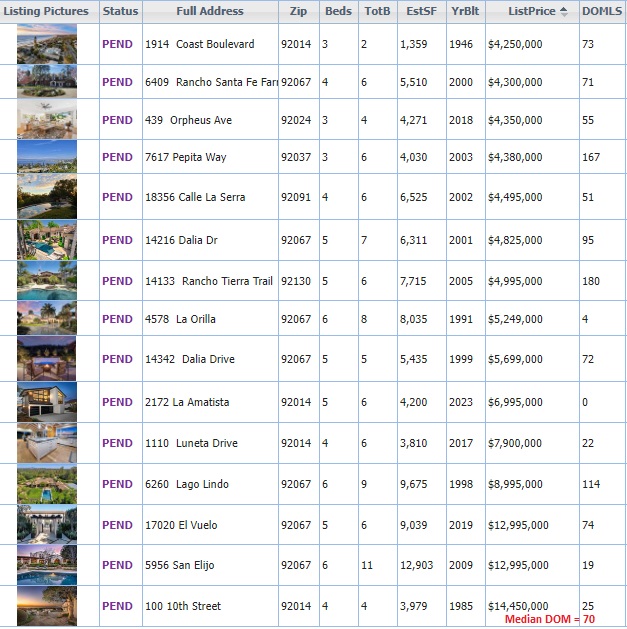
Not mentioned above is the listing that hit the MLS on January 3rd, went pending on the fifth, and closed on the 17th – and went back on the market the next day for $620,000 more:
https://www.compass.com/app/listing/4532-rancho-del-mar-trail-san-diego-ca-92130/1227253413756497393
It sold for $5,380,000 in 2019, $5,959,000 in 2014, and $5,650,000 in 2013.
Here are the historical counts:
| Year |
NSDCC Annual Sales Over $4,000,000 |
Annual Sales Over $10,000,000 |
| 2018 |
125 |
15 |
| 2019 |
126 |
15 |
| 2020 |
235 |
31 |
| 2021 |
356 |
32 |
| 2022 |
275 |
24 |
by Jim the Realtor | Jan 20, 2023 | 2023, Frenzy Monitor, North County Coastal, NSDCC Pendings, Why You Should List With Jim
The reason for breaking down the active and pending listings by zip code is to give the readers a closer look at their neighborhood stats. We have considered a 2:1 ratio of actives-to-pendings to be a healthy market. When there were more pendings than actives, the frenzy was out of control, and when the number of actives reaches a 3:1 ratio of higher, you know that the market is going the other way.
Lately, the ratio has benefitted from cancellations, and today’s A/P ratio is close to the June level:
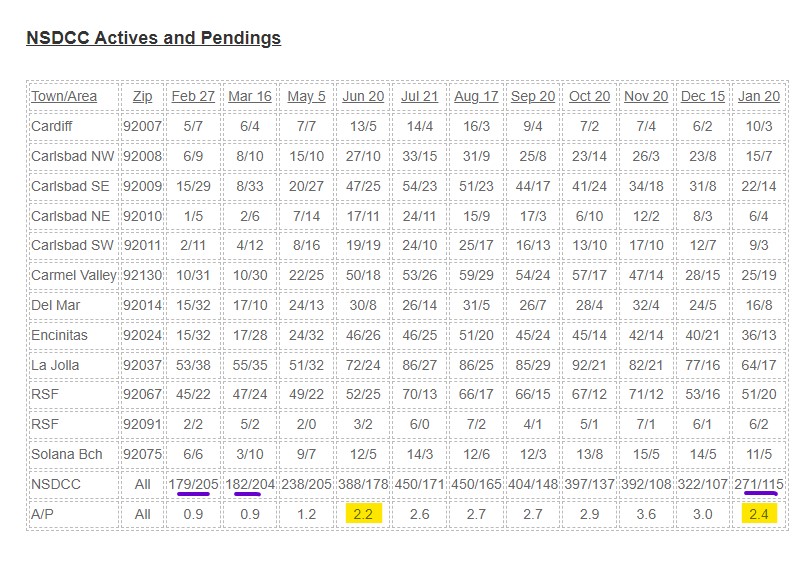
The number of choices today is anemic, and not that much different than the frenzy levels. The combined totals of actives and pendings (underlined in purple above):
Feb: 384
Mar: 386
Jan: 386
Fewer are selling now because of listing exhaustion.
Of the 105 new listings in January:
Number of those on the market in 4Q22, and refreshed as a new listing this month: 44
Number of January listings that were purchased in 2020: 13
Number of January listings that were purchased in 2021 or later: 19
You can say that the inventory of exciting new offerings is extremely tight, especially for those buyers who have been looking since 2020 – you’ve previously seen 72% of the ‘new’ listings.
In 2020, we had 400+ pendings from June 22nd to November 30th – with a peak of 491 pendings on September 7th.
by Jim the Realtor | Jan 19, 2023 | North County Coastal, NSDCC Pendings, Why You Should List With Jim |
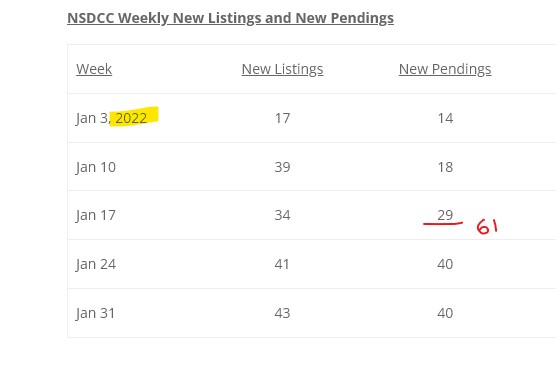
The chart above shows that there were 61 new NSDCC pendings through January 16th last year – when mortgage rates were in the low-3s and we were in full frenzy mode.
Through the 18th, there are 62 new pendings this month!
We are on about the same pace as last year? Who woulda thunk it?
by Jim the Realtor | Jan 17, 2023 | 2023, North County Coastal, NSDCC Pendings, Why You Should List With Jim
Yesterday, we saw that there has been a flurry of new pendings this month.
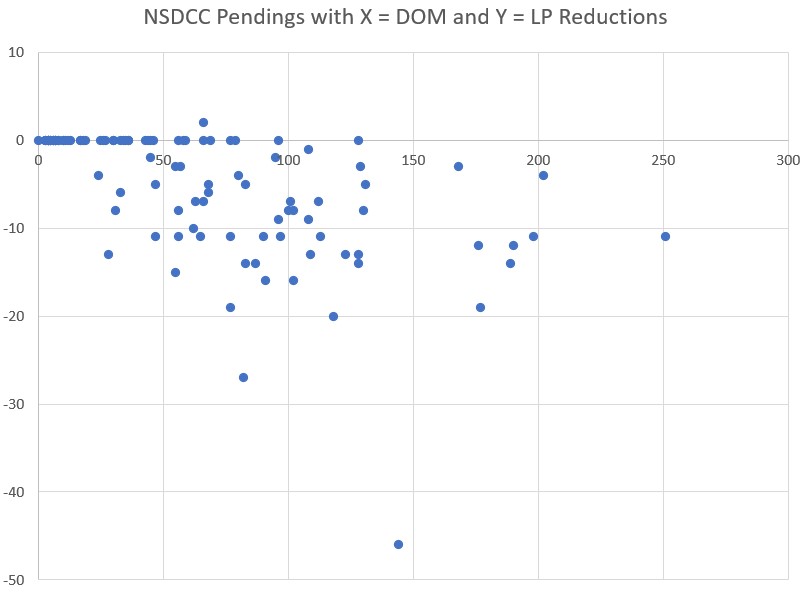
Could it be a result of brave buyers who have lowballed the sellers? We won’t know until they close escrow. But there is a direct correlation between how long a home has been on the market, and the discount expected by the buyers.
Of the current pendings, 49% didn’t lower their list price – and the median days on market for the whole group is 17 days. If the price is attractive, buyers will step up in the first two weeks and pay it, or close.
But once a NSDCC home is on the market for more than a month, and it can be a slippery slope – mostly because the showings dry up. Unless the sellers are willing to pour (more) money into upgrades, then the next best solution is to lower the price – but once you start lowering, it invites the lowballers. Yes, there were a handful that still went pending without reducing, but those were mostly the high-enders:
You see realtors advertising today to sellers that they need to price their home ‘right’. It’s a bit insulting, if you ask me, because it means they want you to price it at their price, not yours.
An attractive price is more than just money – it sums up the whole package (location, floor plan, condition, ease of showing, and listing agent competence) and causes the buyers to say, “Hey, that’s a nice deal!”
by Jim the Realtor | Jan 16, 2023 | NSDCC Pendings, Why You Should List With Jim |
I suggested that buyers were merely vacationing from the housing hunt over last six months of the year, and some at the open houses this weekend confirmed that it was the case for them.
Last week the median days-on-market for the new pendings in January was 55 days, and it was this week too! We had as many new pendings in the last week as we had in the first two weeks of January combined!
It appears that buyers didn’t mind the prices so much – they just weren’t looking.
by Jim the Realtor | Jan 16, 2023 | Inventory, North County Coastal, NSDCC Pendings
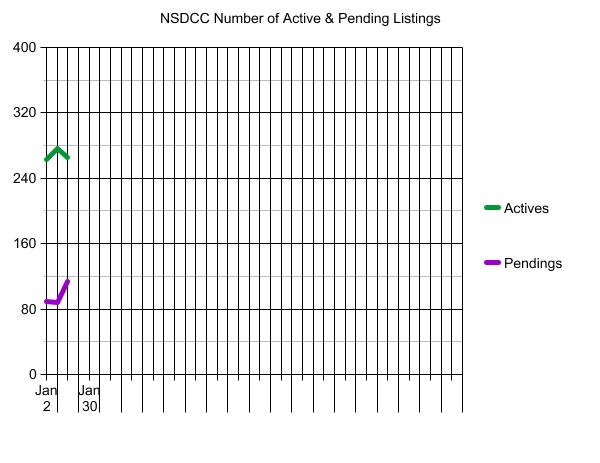
A fantastic start to the new year!
In the last week, there were 36 new listings and 34 new pendings! In the previous week, we also had 36 new listings but only 15 new pendings.
The total pendings count increased +30% in a week!
In the Under-$3,000,000 market, there are 119 actives and 86 pendings, which looks remarkably healthy.
We are about halfway through January, and there have been 80 new listings so far between La Jolla and Carlsbad. It means our contest should wind up around 160-170 listings.
(more…)
by Jim the Realtor | Jan 11, 2023 | Market Surge, North County Coastal, NSDCC Pendings, Spring Kick, Why You Should List With Jim |
First of all, the calendar was perfectly set up for an extended holiday vacation and for everyone to not come back to work until this week. Mortgage rates are double what they were a year ago so nobody can afford a house, plus it’s been raining cats and dogs.
It would be natural to assume that the real estate market is ‘frozen’, and at best we will have a sluggish start.
Yet the early action between La Jolla and Carlsbad has been sizzling:
NSDCC Listings Marked Pending Since Jan. 1st:
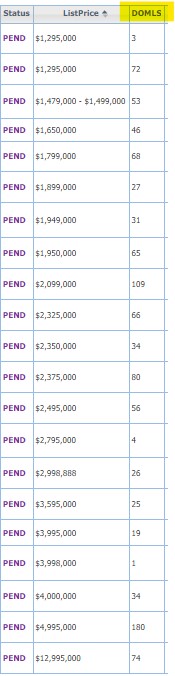
What is impressive is how long these listings have been on the market – the median DOM is 55 days! Wouldn’t buyers lay off those for a few weeks to see where this is going?
Did the sellers dump on price?
Why would they dump on price with the selling season is right around the corner? Surely they would let it run at least 2-3 weeks into January before giving it away, wouldn’t they?
by Jim the Realtor | Jul 21, 2022 | 2022, Actives/Pendings, Frenzy, Frenzy Monitor, North County Coastal, NSDCC Pendings |
The reason for breaking down the active and pending listings by zip code is to give the readers a closer look at their neighborhood stats.
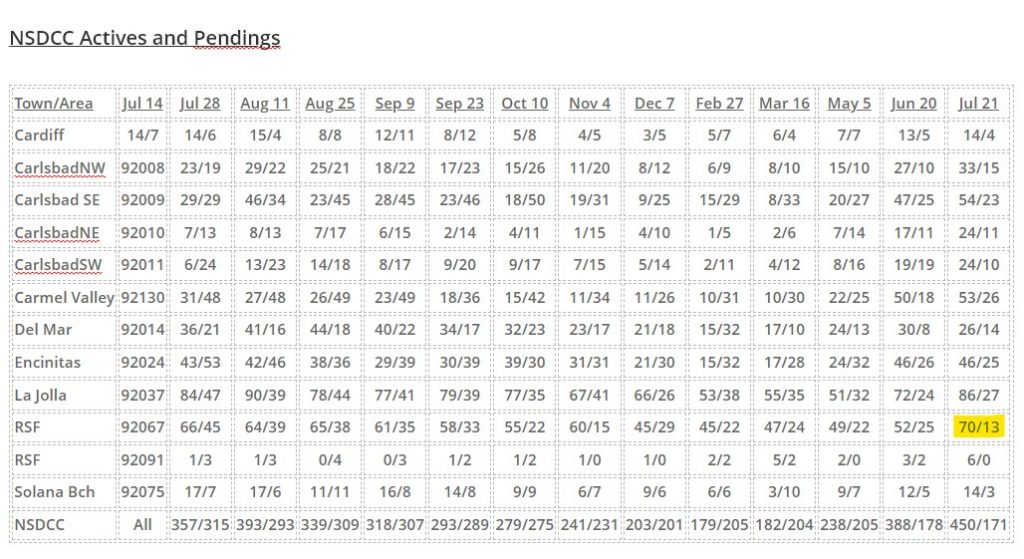
In the recent years prior to the pandemic, the actives/pendings in Rancho Santa Fe ran at a 10:1 pace. Nobody is in a hurry there, they don’t have to sell, and they’re not going to give it away. Those days appear to be coming back.
The median list price of those RSF actives is $5,995,000 – is anyone going to feel sorry for them? Probably not. Does it reflect what is going on in the rest of the area? Not really – the other areas are mostly around a 2:1 ratio (except La Jolla) which has been our standard for a healthy market and pretty good, all considered.
In 2020, we had 400+ pendings from June 22nd to November 30th – with a peak of 491 pendings on September 7, 2020.
by Jim the Realtor | Jun 20, 2022 | Actives/Pendings, Frenzy Monitor, North County Coastal, NSDCC Pendings |
Let’s break down the active and pending listings by zip code is to give you a closer look at the neighborhood stats. We’re going to have more active listings simply because the the list prices were all based on red-hot frenzy conditions (comps + 5% or more), and we’re past the red-hot days.
NSDCC Actives and Pendings
| Town/Area |
Zip Code |
Feb 27 |
Mar 16 |
May 5 |
Jun 20 |
| Cardiff |
92007 |
5/7 |
6/4 |
7/7 |
13/5 |
| Carlsbad NW |
92008 |
6/9 |
8/10 |
15/10 |
27/10 |
| Carlsbad SE |
92009 |
15/29 |
8/33 |
20/27 |
47/25 |
| Carlsbad NE |
92010 |
1/5 |
2/6 |
7/14 |
17/11 |
| Carlsbad SW |
92011 |
2/11 |
4/12 |
8/16 |
19/19 |
| Carmel Valley |
92130 |
10/31 |
10/30 |
22/25 |
50/18 |
| Del Mar |
92014 |
15/32 |
17/10 |
24/13 |
30/8 |
| Encinitas |
92024 |
15/32 |
17/28 |
24/32 |
46/26 |
| La Jolla |
92037 |
53/38 |
55/35 |
51/32 |
72/24 |
| Rancho Santa Fe |
92067 |
45/22 |
47/24 |
49/22 |
52/25 |
| Rancho Santa Fe |
92091 |
2/2 |
5/2 |
2/0 |
3/2 |
| Solana Bch |
92075 |
6/6 |
3/10 |
9/7 |
12/5 |
| NSDCC |
All Above |
179/205 |
182/204 |
238/205 |
388/178 |
The selling season started early in 2022, and was cooking by the end of February. Let’s group the different areas based on how their pendings are holding up.
Frenzy-ish:
Carlsbad SW – A few houses finally went up for sale, and buyers responded.
Rancho Santa Fe – The active listings aren’t growing like in the other high-end areas of Del Mar and La Jolla, and the number of pendings are very impressive. It was once normal when the Ranch had a 10:1 ratio between actives and pendings!
Normal-ish:
Everyone else, except……
Crash Zone
Carmel Valley – which has always had more pendings than actives over the last two years – and sometimes twice as many pendings! While having 50 actives and 18 pendings anywhere else would be a win, in the CV it feels like a meltdown.
Here they are:
(I tried to sort those by price order, but all they have is sort by date added)
~~~~~~~~~~~~~~~~~~~~~~~~~~~~~~~~~~~~~~~~~~~~~~~~~~~~~~~~~~~~~~~~~~~~~~~
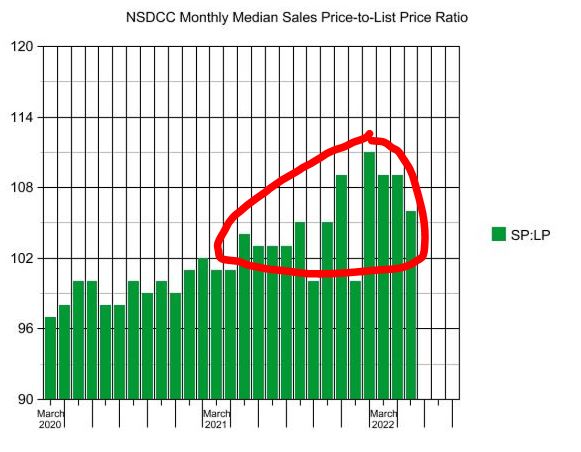
This nonsense about every buyer paying way over list price has to stop. If the SP:LP was around 100% we’d be elated, yet it was 111%, 109%, and 109% in the February-April stretch.
So far in June, the SP:LP is 107% for the 104 detached-home sales between Carlsbad and La Jolla!
~~~~~~~~~~~~~~~~~~~~~~~~~~~~~~~~~~~~~~~~~~~~~~~~~~~~~~~~~~~~~~~~~~~~
We can also track the average market times too. Any upward trends here would indicate market slowing – it’s early so nothing too startling yet:
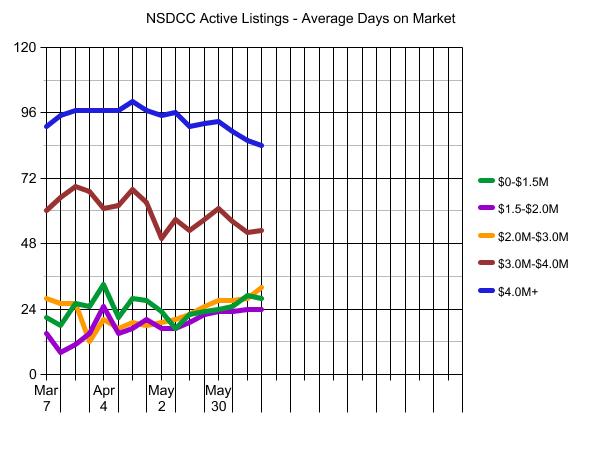
The hottest of the red-hot was in 2020, when we had 400+ pendings from June 22nd to November 30th – with a peak of 491 pendings on 9/7/2020. Today we have 178 pendings.
by Jim the Realtor | Sep 23, 2021 | Market Conditions, NSDCC Pendings, Thinking of Building?, Thinking of Buying?
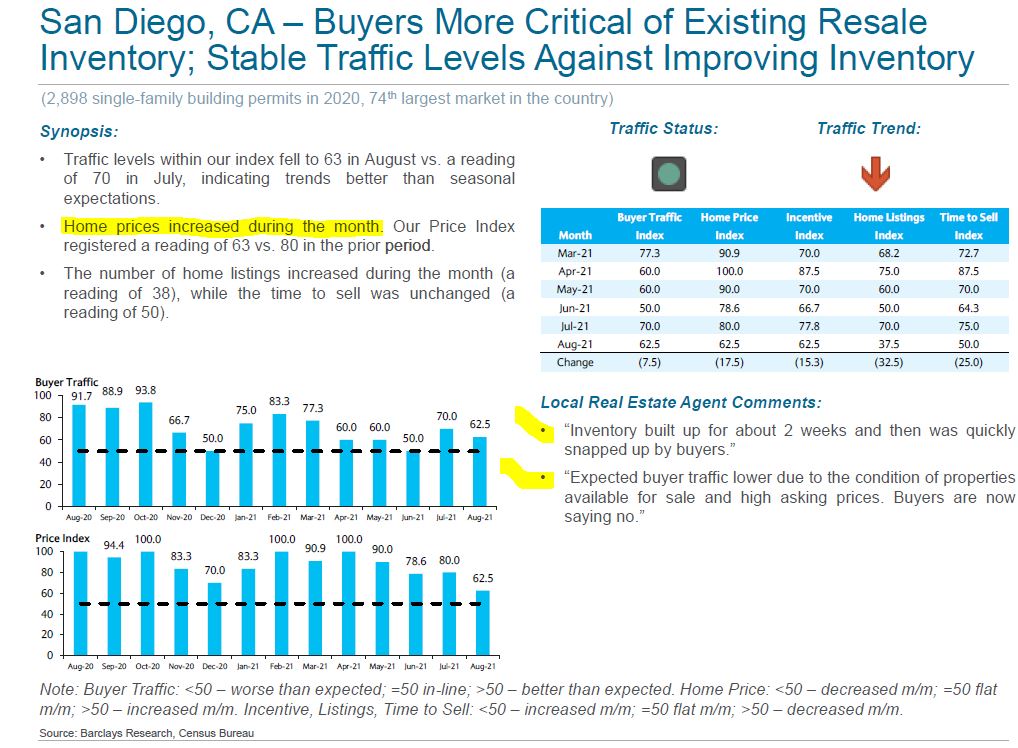
This company surveys new-home and resale agents every month, and this report confirms more of what we’ve been experiencing:
- A few more listings (but NSDCC listings are dropping off now).
- More listings not selling/buyers getting pickier.
- Buyer traffic is steady, and better than expected.
The Home Listings Index dropped from 70 to 37.5, which means the number of listings increased, which is bad for the new-home agents. But for resale agents, it’s good!


