by Jim the Realtor | Mar 1, 2023 | 2023, Frenzy, Market Conditions, Monthly Sales Count, North County Coastal
It was the most insane frenzy ever, and it was the most intense at the beginning of last year as inventory started to thin out. Compared to that environment, I think these stats look pretty good:
NSDCC Monthly Sales and Pricing
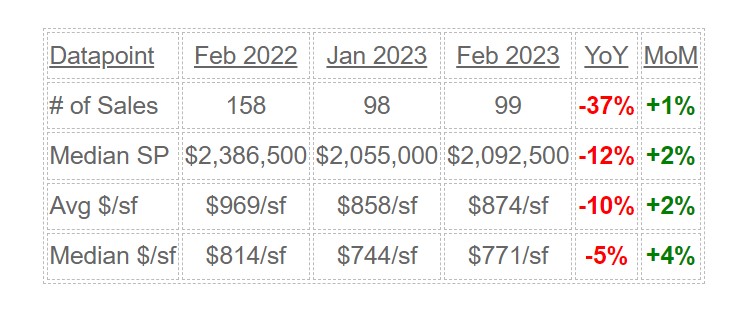
Down 5% to 10% YoY, and on the rise? I’ll take it!
by Jim the Realtor | Jun 19, 2015 | Local Flavor, Market Buzz, Market Conditions, Monthly Sales Count
The state is cooking! She brings up a good point – it might be hotter if there was more to sell:
California home sales softened in May, but the housing market momentum continued to be solid as the spring home-buying season marked higher year-over-year home sales and prices for the fourth straight month, according to the CALIFORNIA ASSOCIATION OF REALTORS® (C.A.R.).
Highlights
- Home sales rose above the 400,000 mark in May for the second straight month since October 2013 and were the second highest level in nearly two years. Closed escrow sales of existing detached homes in California totaled a seasonally adjusted annualized rate of 423,360 units in May.
- The May figure was down 1.1 percent from the revised 427,880 homes sold in April, slightly below the long-run April-to-May average sales increase of 0.6%.
- Home sales were up 8.9 percent from a revised 388,690 in May a year ago though, and the statewide sales figure so far has outpaced last year by more than 5 percent.
 C.A.R. President Chris Kutzkey commented, “The spring home-buying season continues to be strong, especially in areas where insufficient housing supply is less of an issue. With mortgage interest rates edging up recently and an imminent increase in rates by the Federal Reserve, housing affordability concerns will be heightened but may also prompt prospective buyers to feel a sense of urgency to enter the market.”
- The median price of an existing, single-family detached California home edged up in May from both the previous month and year for the fourth consecutive month. The median home price was up 0.8 percent from $481,880 in April to $485,830 in May, the highest level since November 2007.
- May’s median price was 4.4 percent higher than the revised $465,470 recorded in May 2014. The median sales price is the point at which half of homes sold for more and half sold for less; it is influenced by the types of homes selling as well as a general change in values.
- While sales continued to improve from last year at the state level, the number of active listings dipped slightly from the previous year, keeping the supply of homes on the market flat. The May Unsold Inventory Index was unchanged from the 3.5 months reported in April.
http://www.car.org/newsstand/newsreleases/2015releases/may2015sales
by Jim the Realtor | Feb 4, 2012 | Monthly Sales Count
It may feel like a bumpy ride, but today’s local market looks pretty smooth, statistically. Here are detached sales for January:
| Area |
Jan. 2011/2012 Sales (chg) |
Jan. 2011/2012 Avg. Cost-per-sf (chg) |
| SD Co. |
1,269, 1,356 (+7%) |
$229/sf, $226/sf (flat) |
| DM/RSF/SB |
23, 29 (+26%) |
$510/sf, $518/sf (+4%) |
| Cbad/Enc |
85, 85 (flat) |
$297/sf, $307/sf (+3%) |
Some days the MLS statistics don’t work for La Jolla, hard to figure why.
by Jim the Realtor | Jan 3, 2012 | Market Conditions, Monthly Sales Count, North County Coastal, Sales and Price Check |
We’ve seen the detached sales/price statistics be fairly flat around here the last couple of years.
If anything, the year-over-year stats in most most zips are down slightly, but check a couple of interesting hot spots – Del Mar and Rancho Santa Fe.
There will be some late-reporters, but as of today, this sums up the 2011 sales and pricing:
| Town or Area |
Zip Code |
2010 Sales |
2011 Sales |
2010 Avg $/sf |
2011 Avg $/sf |
| Cardiff |
92007 |
62 |
87 |
$380/sf |
$462/sf |
| Carlsbad NW |
92008 |
139 |
161 |
$318/sf |
$311/sf |
| Carlsbad SE |
92009 |
515 |
503 |
$267/sf |
$251/sf |
| Carlsbad NE |
92010 |
110 |
145 |
$253/sf |
$238/sf |
| Carlsbad SW |
92011 |
204 |
184 |
$296/sf |
$290/sf |
| Del Mar |
92014 |
94 |
154 |
$652/sf |
$676/sf |
| Encinitas |
92024 |
380 |
364 |
$370/sf |
$356/sf |
| La Jolla |
92037 |
257 |
270 |
$623/sf |
$600/sf |
| Poway |
92064 |
401 |
464 |
$276/sf |
$254/sf |
| RSF |
92067 |
170 |
173 |
$429/sf |
$427/sf |
| Solana Beach |
92075 |
89 |
75 |
$535/sf |
$531/sf |
| RSF |
92091 |
23 |
24 |
$488/sf |
$414/sf |
| Mira Mesa |
92126 |
414 |
400 |
$266/sf |
$247/sf |
| West RB |
92127 |
450 |
428 |
$270/sf |
$261/sf |
| Rancho Bern |
92128 |
445 |
383 |
$275/sf |
$256/sf |
| Rancho Pen |
92129 |
366 |
303 |
$277/sf |
$261/sf |
| Carmel Valley |
92130 |
417 |
418 |
$340/sf |
$327/sf |
| Scripps Rch |
92131 |
296 |
303 |
$273/sf |
$259/sf |
| NSDCC |
All |
2,460 |
2,558 |
$380/sf |
$375/sf |
| All Above |
All Above |
4,431 |
4,839 |
$332/sf |
$319/sf |
Updated 1/20/12
by Jim the Realtor | Dec 27, 2011 | Monthly Sales Count, Sales and Price Check, Same-House Sales |
The Case-Shiller Index for October, 2011 was published today, and the media is swamped with negativity. CR prefers the seasonally-adjusted; here are both for San Diego:
| San Diego CSI |
Sept |
Oct |
MOM % chg |
YOY % chg |
| SA |
151.67 |
151.61 |
-0.04% |
-4.5% |
| NSA |
153.72 |
152.86 |
-0.5% |
-4.5% |
There’s the soundbite – “prices” are still going down, according to the Case-Shiller Index.
We’ve picked apart their methodology before – today let’s examine how many sales are excluded in their rolling three-month counts.
They compare the most recent sales price to the previous sales price of existing single-family homes only (no condos). They then weight the data based on the time interval, and any extreme price changes. Typically 85% to 90% of the sales pairs receive no down-weighting.
But they also exclude sales too.
They state that the excluded ‘non-arms-length’ sales pairs are “usually less than 5%” of the total, and that new-builts and flippers could exclude another 0 to 15% of the total sales too. (See pages 8 and 19 here).
So let’s say that they think 2% to 20% of the actual sales are left out. Or is it more?
Standard & Poors/Case-Shiller does publish their counts of sales pairs, but they don’t add up:
| SD Sales Counts |
Case-Shiller |
SD MLS |
| Aug |
2,550 |
1,925 |
| Sep |
2,390 |
1,892 |
| Oct |
2,397 |
1,640 |
| Total |
7,337 |
5,457 |
Their published counts can’t be just the one-month total, because they are way too high. If their published number is the 3-month total, then they are excluding more than half of the detached sales, according to the MLS count.
Sure, a survey of half of the sales is worthy. But when the index is only moving 1% to 2% per month, it wouldn’t take many of the excluded sales to drastically influence the outcome in either direction. Yet, that isn’t mentioned anywhere – instead, the media uses the CSI like it is a gold-plated AAA-rated fact about “prices”.
Just like with the NAR data, don’t make decisions solely based on what you think the Case-Shiller index says. The best gauge is the on-the-ground survey done with your own eyes and ears.
by Jim the Realtor | Nov 14, 2011 | Monthly Sales Count, Psycho-babble, Sales and Price Check, Short Sales |
From sddt.com:
 Add another data point to housing’s ongoing bounce along the market bottom.
Sales activity of existing homes in San Diego County slipped on a monthly basis in October, falling roughly in line with its year-ago level, according to recent data.
The San Diego Association of Realtors (SDAR) reported that buyers purchased 2,292 total homes last month, virtually unchanged from the 2,297 sold last October but down 9 percent from a month earlier.
Of the homes sold in October, 1,546 were single-family homes. The single-family total is 10 percent fewer on a monthly basis but 3 percent above October 2010.
The 746 condos sold last month represented declines of 6 percent from both the previous and year-ago months.
Among single-family homes, the median sales price — measuring only the cost of the median home of all properties sold during the defined period, rather than a broad change in housing values –fell 1.3 percent from September and 7.6 percent from last October, to $355,000.
The median condo sold for $207,500, down 1.1 percent from September and 2.8 percent from last October.
The most pronounced change in the SDAR numbers, on an annual basis, is the average time properties spent on the market last month. Single-family homes sold in an average of 91 days, 18 percent more than the 77 average days spent on market last year, and 12 percent more than a month earlier.
The for-sale inventory, especially on the low end of the market, has grown picked over as the distressed properties in the best condition are quickly snatched up after going on the market. Making matters worse, sellers who would typically be looking to enter the move-up market have abstained due to low prices and an unstable labor market.
“People go out and they get very discouraged looking at what’s on the market,” said Alan Nevin, principal of The London Group Realty Advisors last week, reached last week to discuss housing affordability in San Diego. “The number of listings of homes under 500 in acceptable areas is negligible.” (I think he means under $500,000)
Russ Valone, president and CEO of MarketPointe Realty Advisors, said the increasing prevalence of short sales might also account for the rising days spent on market average.
The average is calculated from the time a property is listed to the time it closes, not when it enters escrow. The notoriously lengthy transaction timeline of short sales could push up the average, even if other properties aren’t necessarily spending additional time on the market.
(JtR: The paragraph above is inaccurate, the DOM is calculated from listing date to pending date)
Short sales account for roughly 8 percent of all home sales this year, up from 7 percent in 2010, 5.5 percent in 2009 and 3 percent in 2008, according to CoreLogic.
Valone said the increasing share of short sales is also in part responsible for the softness in prices. “We’ve been bumping along the bottom for a good year,” he said. “Look at housing market, and softness, has little to do with housing, has to do with larger macroeconomics.”
The market needs echo boomers — children of baby boomers — to leave the rental market and become home buyers, according to Valone.
As long as the labor market remains weak, though, they’ve opted for flexibility over building equity.
“People who don’t own now should be coming into the market with zeal, with good interest rates and prices, and instead they’re saying ‘I don’t know if I’ll be full-time employed in San Diego,’ so they want the flexibility that staying in the rental market affords them,” he said.
While some analysts’ predictions have surpassed the general forecast that prices won’t fall more than another few percentage points, and have suggested they could come down as much as another 7 percent, those losses still don’t represent a great deal of money in the long run, according to Valone. More than a fear that values are still on the way down, it’s a fear of the current labor market that’s keeping young would-be buyers on the wrong side of the fence, he said.
“Housing won’t lead us out,” he said. “Instead of it being the lead engine pulling the train, it’ll be in the back pushing the train.”
Through ten months, total home sales have slipped 3 percent from last year, when the homebuyer’s tax credit propped up sales early in the year, led primarily by a decline in condo sales.
County buyers have purchased 8,902 condos this year, down 8.3 percent from the year-ago period’s 9,709.
Meanwhile, 17,565 single-family homes have been sold this year, down less than a percent from last year’s 17,603.
The average days on the market for the entire year among single-family homes has increased 13 percent, from 74 to 84, while condos are now spending an average of 96 days on the market, up 14 percent from 84 during the first 10 months of 2010.
The median sales price of a single-family home sold this year, $368,000, is 4 percent less than the median home’s price last year. In the condo market, the median price has fallen 5 percent to $207,500.
~~~~~~~~~~~~~~~~~~~~~~~~~~~~~~~~~~~~~~~~~~~~~~~~~~~~~~~~~~~~~~
~~~~~~~~~~~~~~~~~~~~~~~~~~~~~~~~~~~~~~~~~~~~~~~~~~~~~~~~~~~~~~
JtR’s research:
Now that there are so many companies reporting sales and pricing, the numbers tend to vary.
I don’t know where CoreLogic gets their “8% of sales this year were short sales”. Of the detached and attached home sales in San Diego County this year, the MLS shows that 21% have been short sales, and 23% have been REO sales.
San Diego County sales counts for first ten months (1/1 – 10/31)
| Type |
2010 # |
2010 % |
2011 # |
2011 % |
| All Sales |
27,433 |
|
26,669 |
|
| Shorts |
5,303 |
19% |
5,548 |
21% |
| REOs |
6,235 |
23% |
6,089 |
23% |
by Jim the Realtor | Jan 24, 2011 | Double Dip, Monthly Sales Count, Sales and Price Check |
 There is more hub-bub at cnbc about December being full of distressed sales.
NAR had reported that 36% of December sales nationally were REOs and short sales, and the new report from Campbell Surveys said 47%.
How about North San Diego County Coastal?
December Detached Sales and Price-per-SF:
| Type |
2009 |
2010 |
| REO |
25/$295 |
18/$320 |
| SS |
17/$267 |
19/$315 |
| Reg. |
197/$428 |
167/$400 |
| Totals |
239/$403 |
204/$385 |
No change year-over-year in NSDCC – an identical 18% of December sales were distressed.
Overall, the YOY sales were down 15%, and pricing down 4%, but when you look around, or talk to some of these listing agents, you’d think it was 2005 all over again!
by Jim the Realtor | Nov 29, 2010 | Monthly Sales Count, Sales and Price Check, Thinking of Buying? |
Welcome back from the long holiday weekend everybody – hope it was great!
I took off the last five days to help my mother with moving, so I’m just getting back in the swing. After checking the November sales yesterday (repeated below), the pendings for this month were expected to be gloomy. But as you’ll see, the ultra-low mortgage rates are helping motivate buyers and sellers to get together:
| Month/Year |
# of Pendings |
| Nov. 2008 |
2,355 |
| Nov. 2009 |
2,420 |
| Nov. 2010 |
2,233 (so far) |
Yes, we’ll see how many close, but let’s also tack on at least 10% more sales to the 2010 number below to account for the late reporters – here are the closed counts, as of today:
| Month/Year |
# of Solds |
Avg. $/sf |
| Nov. 2008 |
2,384 |
$225/sf |
| Nov. 2009 |
2,733 |
$233/sf |
| Nov. 2010 |
1,606 |
$259/sf |
The vacant properties are a curiousity, here is how today’s active listings compare with previous:
| Month/Year |
# of Vacants/Total Active Listings |
Percentage |
| Oct. 2008 |
6,876/16,947 |
40.6% |
| Feb. 2009 |
5,600/14,518 |
38.6% |
| Nov. 2010 |
4,795/11,929 |
40.2% |
Even the sellers of vacant properties are reluctant to sharpen their price. The avg. days-on-market is 88 days, and only 25% of the listings are REOs!
by Jim the Realtor | Sep 22, 2010 | Monthly Sales Count, Sales and Price Check |
 The N.A.R. will be releasing the existing-home sales number tomorrow, and a rout is expected.
The consensus is that August sales improved over July’s number, but they think the year-over-year stats could plunge. The press will focus on any negativity, and call it catastrophic.
Lately there have been numerous reports that the shadow inventory is somewhere between 3 to 8 million homes, but after so many people say it, the impact has become muted. Can we sex those up a bit?
I think soon (any day now) we are going to hear an eight-figure estimate from one of these so-called “experts’ – that the shadow inventory is OVER 10 MILLION HOMES! Because there is no way of knowing the exact count, why not?
It’ll likely come from Rick at RealtyTrac, and it’ll be the new scare.
If the motivated sellers bite, and dump on price to salvage what they can before the headlines get any worse, it’ll be great for buyers.
Here are the SD County MLS sales numbers and percentage changes for August, all property types:
| Month |
# of Sales |
$-per-sf |
DOM |
| Aug 2009 |
2,935 |
$229/sf |
59 |
| Jul 2010 |
2,787 |
$238/sf |
67 |
| Aug 2010 |
2,823 |
$235/sf |
70 |
Sales: Month-over-Month = +1%, Year-over-Year = -4%
Pricing: Month-over-Month = -1%, Year-over-Year = +3%
~~~~~~~~~~~~~~~~~~~~~~~~~~~~~~~~~~~~~~~~~~~~~~~~~~~~~~~~~~~~
North SD County Coastal (La Jolla to Carlsbad)
| Month |
# of Sales |
$-per-sf |
DOM |
| Aug 2009 |
353 |
$362/sf |
77 |
| Jul 2010 |
350 |
$346/sf |
64 |
| Aug 2010 |
336 |
$348/sf |
66 |
Sales: Month-over-Month = -4%, Year-over-Year = -5%
Pricing: Month-over-Month = +1%, Year-over-Year = -4%
I’m going to go out on a limb and guess that our percentage stats will be better than America’s.
by Jim the Realtor | Sep 21, 2010 | Foreclosure Count, Foreclosures/REOs, Monthly Sales Count, North County Coastal, REO Counts, REO Inventory, REOs, Thinking of Buying? |
These days, every time you read the news you’ll see another expert talking about the shadow inventory coming home to roost. Depending on the guesser, there will be somewhere between 3 million and 8 million homes that get foreclosed in America over the next 1-10 years. Can we narrow that down a bit?
The shadow inventory that is hardest to count are the borrowers who are not making their payments, but aren’t on the foreclosure rolls yet. LPS came out with this chart (below), so let’s use their numbers and envision what would happen if banks/servicers change course, and ramp up the foreclosure machine:

The chart shows 17,800 defaults (today the NOD and NOT count is 14,435 on foreclosureradar), and 34,200 properties in San Diego County that are at least 90-days late, for a total of 52,000.
How would it look in your area if EVERY ONE of these were foreclosed in next 12 months?
To estimate the total number of defaulters plus 90-day late borrowers for each area, let’s use the multiplier formula here: 17,800 x 2.92 = 52,000.
Let’s multiply 3x the current defaults in each area/zip code:
| Area or Zip Code |
NODs/NOTs x 3 |
# of Homes |
1 REO per # homes |
Foreclosed since 1/1/07 |
| Spring Valley |
783 |
9,368 |
12 |
1,777 |
| West RB 92127 |
378 |
7,140 |
19 |
506 |
| Chula Vista |
3,051 |
59,529 |
20 |
6,675 |
| Otay Mesa |
825
| 17,197 |
21 |
1,807 |
|
| Encanto |
780 |
17,869 |
23 |
1,675 |
| Escondido |
1,605 |
44,964 |
28 |
3,934 |
| El Cajon |
1,068 |
35,173 |
33 |
2,652 |
| Oceanside |
1,698 |
59,498 |
35 |
3,962 |
| RP 92129 |
348 |
15,109 |
43 |
487 |
| Scripps Rch |
222 |
10,521 |
47 |
288 |
| Carmel Valley |
237 |
11,304 |
48 |
291 |
| Carlsbad |
672 |
33,717 |
50 |
987 |
| RSF |
63 |
3,517 |
56 |
71 |
| Cardiff |
78 |
4,544 |
58 |
58 |
| Encinitas |
303 |
19,138 |
63 |
305 |
| Solana Bch |
81 |
6,072 |
75 |
102 |
| La Jolla |
246 |
19,529 |
79 |
257 |
| PB/MB 92109 |
261 |
26,105 |
100 |
285 |
| Del Mar |
66 |
6,714 |
102 |
78 |
If servicers crack down and foreclose on every 90-day late property, we’ll see one flipper or REO listing on virtually every block in areas like Spring Valley. But with all the foreclosure activity over the last few years, would it bother buyers to see 1 out of 40 or 50 homes getting foreclosed? I don’t think so, and this is probably the worst-case scenario over the next year. The current SD default list is split 65% SFRs, and 35% condos/others, so spread it around as you visualize what might happen in your area over the next 12-18 months.
In areas like Carmel Valley, where we’re estimating 237 SFRs and condos on the NOD/NOT/90-day list, it would bring relief to buyers starved for well-priced inventory. We know some defaulters will get their loan mod or be short-sold, but if not, and 15-20 foreclosures per month came on the market, it wouldn’t overwhelm the market – 71 homes sold there last month. Hopefully, it might scare some of the elective sellers back to the sidelines, to be replaced by bank-owned inventory.
In Carlsbad, if you divide the current NOD/NOT/90-day list by 12, it would mean roughly 56 REO or flipper listings per month, and 124 sold there in August.
We’ve expected that we’d be in a heavy bank-inventory environment by now, yet the ‘delay-and-pray’ strategy has been employed instead. If 30% to 50% of the for-sale inventory was well-priced bank deals (flippers are retail-plus) it could boost sales. If servicers insist on the extend-and-pretend strategy, sales are going to slow down, unless elective sellers get more realistic.
Servicers, please foreclose on every defaulter in the next 12 months – homebuyers would appreciate the well-priced inventory!


