Entry-Level Frenzy
This is as far east as you can get in Oceanside, so it’s not really much a coastal home when it’s 4-5 miles away. But this is a great example of what is happening at the entry level of every market today!

This is as far east as you can get in Oceanside, so it’s not really much a coastal home when it’s 4-5 miles away. But this is a great example of what is happening at the entry level of every market today!
This month’s housing stats will benefit from an extra business day due to the leap year, but it will just be icing on the cake. The sales this month have already blown by last February, in spite of higher pricing.
I think we can say that we’re back to frenzy-like conditions:
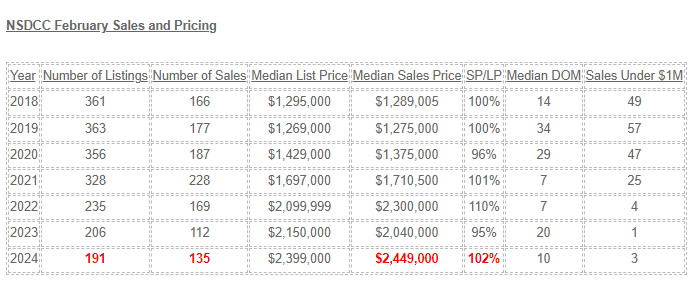
Some agents insist on inputting their listings of attached homes in the SFR category. There has only been ONE house sale under $1,000,000 in the last three Februarys.
This month’s total will probably be around 160-170 sales, which is phenomenal when you consider that we had similar monthly sales counts when pricing was half of what it is today! Not only that, but the number of sales will be close to the total number of listings too – probably closer than during the peak frenzy years.
With declining sales across the country, there are complaints about how bad the market has been, and people are wondering when it will get ‘better’. Better? This is great, relatively, and this is what we’re going to have for the next few years because the boomers are still relatively young (half are still working).
It will take a surge of new listings, and/or a drop in demand, which you’d think would happen naturally as prices go higher. But not yet.
How’s the flow of new listings?
After a hot January that was +18% YoY, the February listings have cooled off – though there will be late-reporters that should get this year’s count up to 220-ish:
NSDCC Monthly Listings
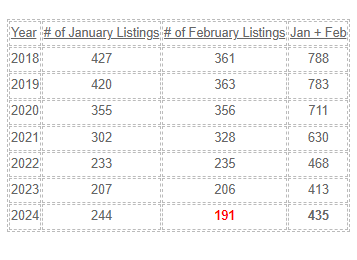
Two months into the new year, I think we have found our groove. The inventory will stay low, and the special homes will keep blowing off the market – with the rest having to find their way.
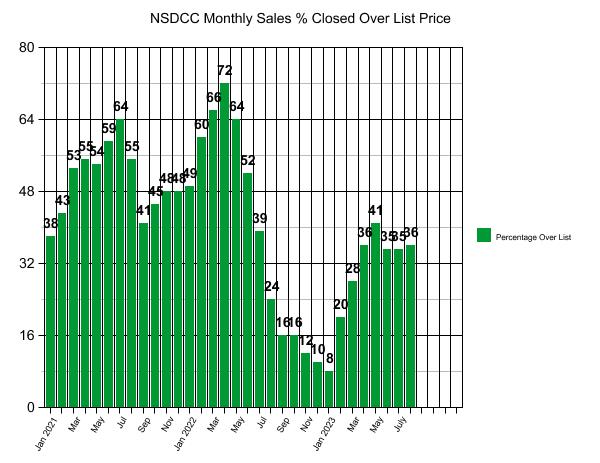
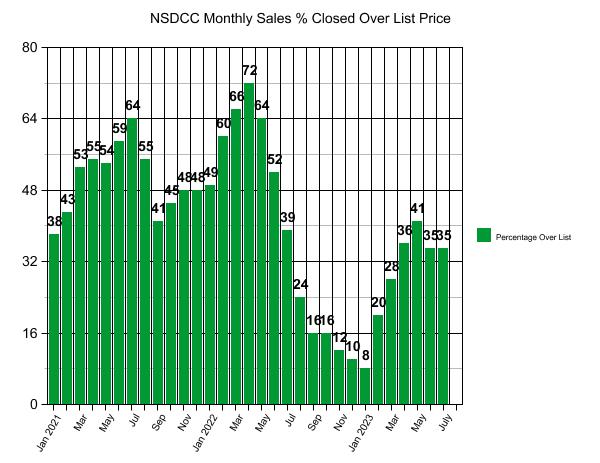
Another good way to anticipate the market trends is to check the direction of the SP:LP ratio:
NSDCC Monthly Sales and SP:LP Ratio
| Month | ||||
| Jan 2022 | ||||
| Feb | ||||
| Mar | ||||
| Apr | ||||
| May | ||||
| Jun | ||||
| Jul | ||||
| Aug | ||||
| Sep | ||||
| Oct | ||||
| Nov | ||||
| Dec | ||||
| Jan 2023 | ||||
| Feb | ||||
| Mar | ||||
| Apr | ||||
| May | ||||
| Jun | ||||
| Jul | ||||
| Aug | ||||
| Sep | ||||
| Oct | ||||
| Nov | ||||
| Dec | ||||
| Jan 2024 | ||||
| Feb |
Pricing looks strong – similar to the March-May, 2022 era, which was the hottest frenzy ever!
On Monday morning, these were the counts of active and pending listings between La Jolla and Carlsbad:
Actives: 312
Pendings: 149
This morning, the counts are:
Actives: 286 (-26)
Pendings: 164 (+15)
These are pre-Super Bowl numbers and it’s been pouring rain for a week!
What’s going to happen once we get into the more-traditional selling season of March, April, and May?
These blog posts are uploaded onto my LinkedIn page, and it was there yesterday that Carl asked what my crystal ball said about pricing this year.
It’s going to keep going up!
The houses that aren’t well presented and are sloppy on price are going to sit. But those that have something special about them, and/or are presented well and have an attractive price are going to find a buyer in the first week or two.
NSDCC Supporting Data:
2023 Median List Price: $2,199,000
2023 Median Sales Price: $2,157,500
January, 2024 Median List Price: $2,200,000
January, 2024 Median Sales Price: $2,275,000
The median list price of today’s 164 pendings: $2,499,950
Some buyers are getting deals, mostly on the scratch-and-dent homes where sellers and listing agents didn’t do much, if anything, to prepare the home for sale. But look at the January median sales price – it’s higher than the median list price!
Here we go again!
We are already on our way to a +10% increase in pricing – and it’s only the first week of February!
One house doesn’t speak for the whole market but it sure felt like it was already peak selling season this weekend. We had 160+ people attend, received eight offers so far, and it’s already $100,000+ over list:
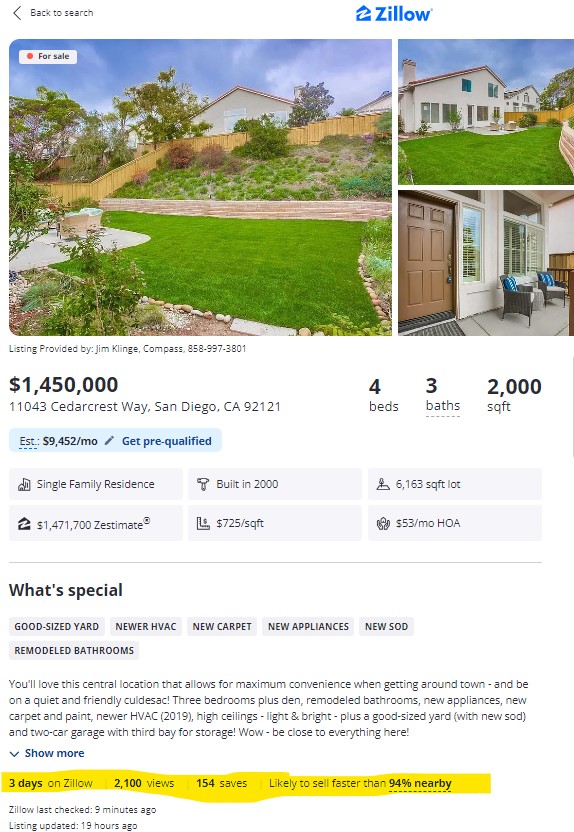
This is the tenth sale in the last month that closed $100,000+ over their list price!
It’s going to be a wild spring selling season!

A former federal regulator who served when the 2006 housing bubble burst is concerned that today’s housing market is on an unsustainable path.
The housing market’s affordability is worse than it’s been in decades as mortgage rates toy with 8%. The median price of a U.S. home was $322,500 in the second quarter of 2019. Then the pandemic housing rush hit, and prices across the nation shot up. High mortgage rates sent sales spiraling, but home prices only experienced a minor correction before heading back up. In the second quarter of this year, the median price was $416,100, according to the Federal Reserve Bank of St. Louis.
“Talk about a bubble. That’s a classic supply-demand imbalance,” Sheila Bair recently told CNN.
Bair, who served as a federal regulator when the mid-2000s housing bubble popped, nearly taking down the entire financial system, said home prices today are “bubbly” following years of low mortgage rates.
A housing bubble can form when prices rise to unsustainable levels. This can be caused by speculative buying, as was the case during the sub-prime mortgage crisis when people who could not make the monthly payments on their mortgages were buying homes with very little money down. The bubble popped when home prices dropped and many people owed more on their home than it was worth.
A bubble can also be caused by irrational exuberance, in which a surge in prices leads to a buying frenzy.
“When rates were cheaper, a lot of people wanted to buy. You ended up with really frothy price increases. That was pretty predictable,” said Bair, who led the Federal Deposit Insurance Corp. from July 2006 until July 2011.
Although Bair said home prices need to correct downward, she’s not confident that will happen anytime soon because there’s still a shortage of homes on the market and she doesn’t expect the bubble to violently burst.
“If supply remains constrained, this could go on for some time,” said Bair, who last week released a new children’s book about bubbles called “Daisy Bubble: A Price Crash on Galapagos.”
There were just 1.1 million existing unsold homes on the market as of the end of August, down 14.1% from the year before, according to the NAR. “Letting that bubble deflate a bit would probably be a good thing,” said Bair. “People who already own their home – and I’m one of them – don’t want to hear that. But for those who want to own, I hope home prices do come down.”
Over the past year, the median home price has increased by 23.8% in Los Angeles, 18.2% in San Diego, 15% in Richmond and 14.6% in Cincinnati, according to Realtor.com.
The good news is Bair does not see a repeat of the bursting of the mid-2000s housing bubble, which set the stage for the Great Recession. That’s in part because a typical homeowner today has more equity in their homes than a homeowner during that time. Only 1.1 million homes, or 2% of all mortgaged properties, owed more on their mortgage than their home was worth in September, according to CoreLogic. That is a small number compared with the share of properties underwater during the sub-prime mortgage crisis, which topped out at 26% in the fourth quarter of 2009, according to CoreLogic’s equity analysis, which began in the third quarter of 2009.
In addition, mortgage lending standards are significantly tougher today, meaning fewer people are borrowing more than they can afford.
“I see much less speculation in the housing market today, thank goodness,” said Bair.
And unlike in the mid-2000s, homeowners today have built up a significant cushion of equity. That means they shouldn’t find themselves in a situation like during the subprime meltdown where many owed more than their homes were worth.
“Even if home prices adjust a bit, people should not be under water,” said Bair.
Legendary investor Jeremy Grantham shares Bair’s concern about a housing bubble. He has been warning of an eventual plunge in home prices around the world.
“Real estate is a global bubble,” Grantham said on The Compound and Friends podcast last month. “Home prices will come down…30% would be a pretty good guess.”
Yet others on Wall Street are confident home prices will continue rising.
Despite high mortgage rates, Goldman Sachs expects US home prices will increase by 1.8% this year and then accelerate to 3.5% growth in 2024. Similarly, CoreLogic forecasts that home prices will increase by 4.3% from June 2023 to June 2024.
Although UBS acknowledges home prices have spiked to “dizzying heights” in recent years, the bank only sees two cities around the world at risk of being in a bubble: Zurich and Tokyo. That’s down from nine cities a year ago. Miami, Los Angeles, Toronto and Vancouver are among the cities that UBS says are in “overvalued” territory.
Fannie Mae CEO Priscilla Almodovar said it’s “unusual” that home prices have not taken more of a hit from high mortgage rates. “What has surprised us the most is the stickiness of home prices,” Almodovar told CNN in a recent interview. “Supply is the issue. There is no place to go. There is a lack of inventory.”
That’s the main reason Lawrence Yun, chief economist at the National Association of Realtors, says homebuyers shouldn’t hold their breath waiting for a drop in home prices.
“There is not going to be a home price crash,” Yun told CNN. “When you have a housing shortage, home prices simply cannot decline in any measurable way.”
While a temporary dip in prices is possible, Yun said a “prolonged” drop of 10% to 15% “cannot happen in this tight supply market.”
Yun noted that many assumed London was in the midst of a housing bubble years ago – only to see prices continue to rise, albeit with fewer people participating.
“It became only a playground for the wealthy. I hope America doesn’t go in that direction,” he said.
In many ways, today’s housing market is the polar opposite of the one that preceded the Great Recession.
Back then, reckless mortgage lending helped create a situation where demand became artificially strong. Eventually, it collapsed and the market was left with way too many homes.
“Today, we have an imbalance the other way. Too much demand, not enough supply,” said Yun.
The NAR has estimated the supply of homes needs to basically double to moderate home prices.
“It’s creating social inequity. The only way out of this situation is we have to induce more supply,” said Yun.
https://www.cnn.com/2023/10/11/economy/housing-market-bubble-sheila-bair/index.html
Given that mortgage rates have been above 7% since the beginning of July, it’s incredible to see August having the highest sales count for 2023!
September is looking pretty good too – there have already been 57 closings this month.
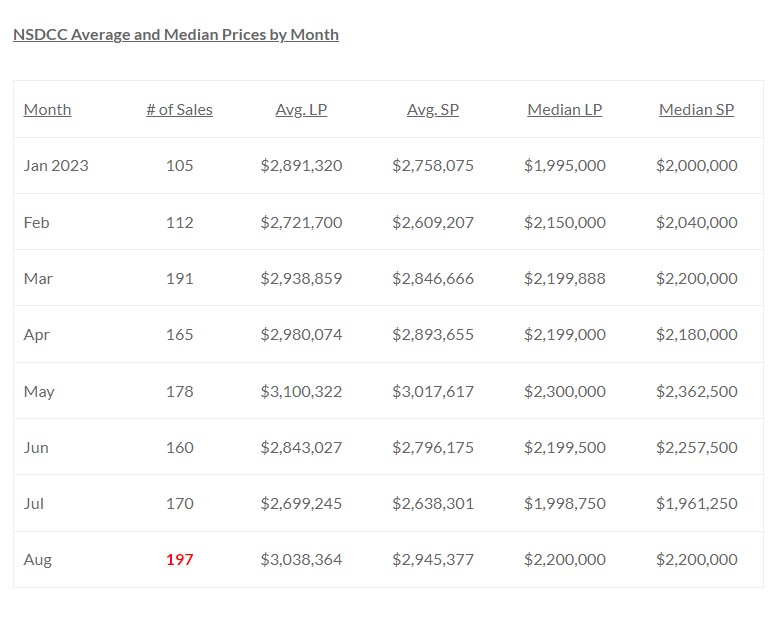
The pricing is holding up too. What a market!
It’s never been like this – Get Good Help!

I hate when realtors say, “Price it right”.
It makes it sound like we know something you don’t – that our price is the right price.
Realistically, you can only say you priced it right if a house sells during its first week on the market. The frenzy made every listing agent look like a rockstar when most of the time it was due to the demand being so high that many listings were selling in spite of its agent and price.
How good are agents about price?
In the first half of 2023, there were 1,377 detached-home listings between La Jolla and Carlsbad. Of those, there are 896 that have sold or are now pending, which is 65%. Hmmm.
Let’s just price them attractively, which isn’t as specific as ‘right’. Put a price on it that causes people to want to come take a look, and then when they arrive, be a good enough salesperson to handle the rest.
~~~~~~~~~~~~~~~~~~~~~~~~~~~~~~~~~~~~~~~
One way an agent can stay sharp about pricing is to see homes in person. The frenzy prevented us from doing the broker previews on Tuesdays and Wednesdays, and those were the best way to easily view the new listings.
Buyers go to open houses on the weekends, and shouldn’t we know as much as them?
It’s easy to shrug off the broker previews if you don’t have any waiting buyers for the homes on the list. But seeing homes every week also helps to keep an agent sharper about pricing in general – and also build better relationships among the agents who are on the tour.
I’ll have my Aviara Drive listing on broker preview tomorrow from 10:00am to 1:00pm with food. I told the sellers that my over/under on agent attendance is 15, which doesn’t sound like many when there are 1,000+ agents working in the area.
Anyone who attends tomorrow and mentions the blog will get a bubbleinfo t-shirt – non-agents included!
https://www.compass.com/app/listing/7141-aviara-drive-carlsbad-ca-92011/1364510398054940729
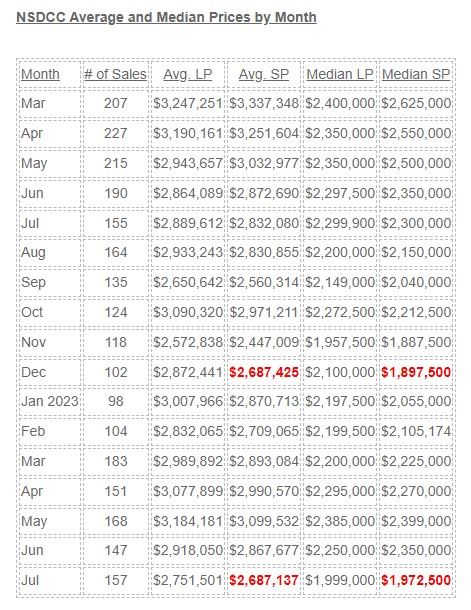
The average and median sales prices last month were similar to what they were in December, even though the same percentage of buyers paid over the list price.
It might make you think that this market is retreating quickly!
But look at the difference of the number of lower-end sales, and square footages:
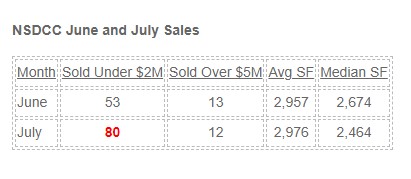
The size of the houses weren’t that different, so what’s up?
Buyers aren’t bidding up the prices like they were before. Here’s an example of those right under the median sales price last month:
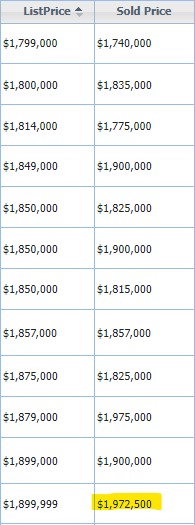
Instead of overbidding by hundreds of thousands of dollars, buyers in July mostly stayed in their shoes and only offered a little over the list price. Expect that trend to continue!


Are you looking for an experienced agent to help you buy or sell a home?
Contact Jim the Realtor!
CA DRE #01527365, CA DRE #00873197
