by Jim the Realtor | Sep 10, 2021 | Actives/Pendings, Frenzy Monitor, North County Coastal
The reason for breaking down the active and pending listings by zip code is to give the readers a closer look at their neighborhood stats.
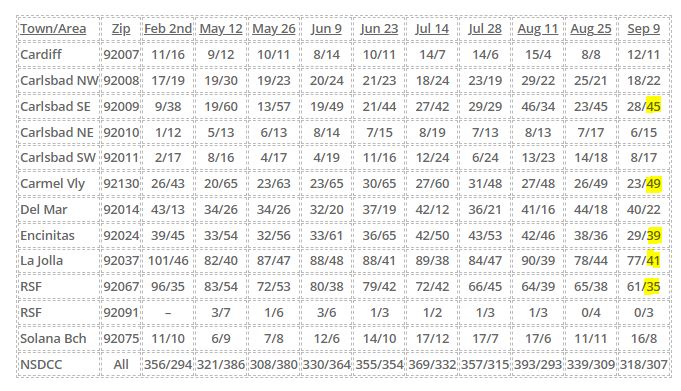
Our Big Three – Carmel Valley, Encinitas, and SE Carlsbad – continue to carry substantially more pendings than active listings, but both La Jolla and Rancho Santa Fe have similar pending counts, which is incredible given their much-higher price points:
NSDCC Actives and Pendings
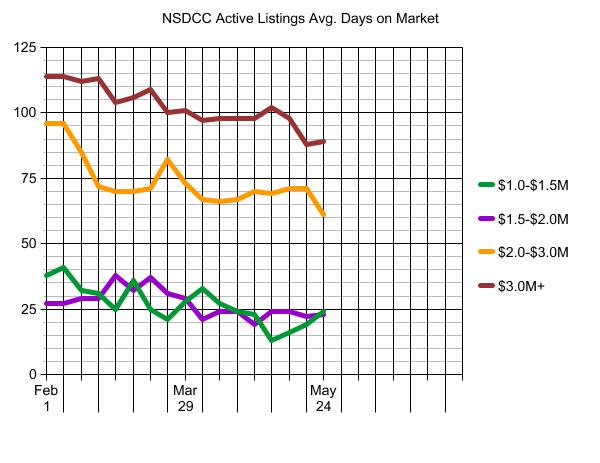
The average days on market is creeping upward, but still no big concerns. There will always be sellers who would rather wait for the lucky sale, than adjust their price – and longer average market times indicate more sellers doing the former:
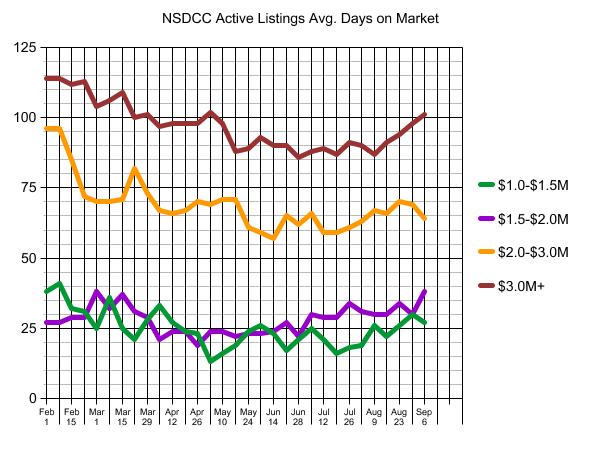
The $1,500,000 – $2,000,000 range has been the hottest all year, but their average DOM is at its high – while the rest are well below theirs!
by Jim the Realtor | Jul 12, 2021 | Actives/Pendings, Inventory
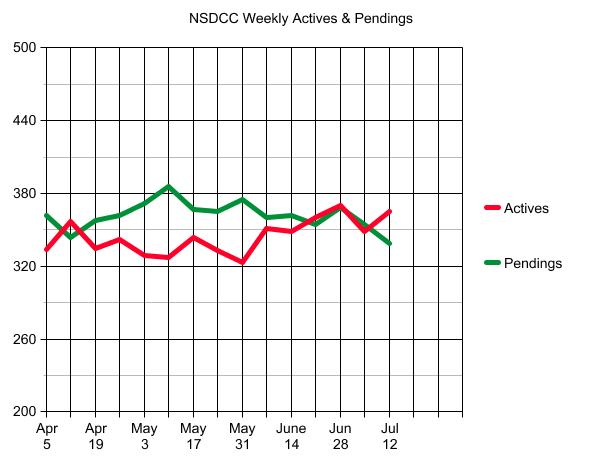
As long as there are more pendings than actives, the market is doing just fine.
Oh well – that was last week’s thought.
As you can imagine, it’s the high-end market that is loaded with actives. This week an agent commented on what a delightful experience he had showing higher-end homes in Rancho Santa Fe, where listing agents were happy to book appointments at the buyers’ convenience, didn’t go crazy about having to submit financials just to see a home, and were paying regular commissions. A few of the homes had been sitting around for months!
My guess is that most of the disappointed sellers will pack it up and wait until next year, rather than consider selling for today’s top dollar – which might be slightly less than they thought (but 10% to 30% more than it was 2-3 years ago).
How’s the action in the more reasonably-priced categories?
There are 100 active listings, and 191 pendings priced under $2,000,000 today.
~~~~~~~~~~~~~~~~~~~~~~~~~~~~~~~~~~~~~~~~~~~~~~~
(more…)
by Jim the Realtor | May 26, 2021 | 2021, Actives/Pendings, Frenzy, Frenzy Monitor |

To help get a sense of the frenzy conditions, let’s monitor the number of active & pending listings per area.
If the active (unsold) listings start to rise, we will know that pricing is becoming an issue.
But so far, the demand for detached homes between Carlsbad and La Jolla is solid, and buyers are enduring prices that are 20% to 30% higher than last year:
NSDCC Actives and Pendings
| Town or Area |
Zip Code |
Actives/Pendings, Feb 2nd |
May 12th |
May 26th |
| Cardiff |
92007 |
11/16 |
9/12 |
10/11 |
| Carlsbad NW |
92008 |
17/19 |
19/30 |
19/23 |
| Carlsbad SE |
92009 |
9/38 |
19/60 |
13/57 |
| Carlsbad NE |
92010 |
1/12 |
5/13 |
6/13 |
| Carlsbad SW |
92011 |
2/17 |
8/16 |
4/17 |
| Carmel Valley |
92130 |
26/43 |
20/65 |
23/63 |
| Del Mar |
92014 |
43/13 |
34/26 |
34/26 |
| Encinitas |
92024 |
39/45 |
33/54 |
32/56 |
| La Jolla |
92037 |
101/46 |
82/40 |
87/47 |
| RSF |
92067 |
96/35 |
83/54 |
72/53 |
| RSF |
92091 |
– |
3/7 |
1/6 |
| Solana Beach |
92075 |
11/10 |
6/9 |
7/8 |
| NSDCC |
All Above |
356/294 |
321/386 |
308/380 |
The 92009, 92011 and 92130 (SE Carlsbad, SW Carlsbad, and Carmel Valley) are scorching hot, with 4x, 4x and 3x as many pendings as actives! But Rancho Santa Fe is the most impressive of all. There have been times when there were 10x as many actives as pendings in 92067 – today it’s 1.4x!
With the 30-day closings, there shouldn’t be any drastic changes here – let’s examine the trends over time.
We can also track the average market times too. Any upward trends here would indicate market slowing:
I’ll run this every couple of weeks.
by Jim the Realtor | Mar 16, 2021 | Actives/Pendings, Market Conditions, Market Surge, North County Coastal, NSDCC Pendings

Previously we experienced a healthy market when actives outnumbered pendings 2:1. Then as the market heated up, we got used to the 1:1 ratio. Now we have areas where the ratio is more than 1:2!
NSDCC Detached-Home Active and Pending Listings
| Town or Area |
Zip Code |
Actives |
Pendings |
| Cardiff |
92007 |
10 |
14 |
| NW Carlsbad |
92008 |
15 |
24 |
| SE Carlsbad |
92009 |
20 |
48 |
| NE Carlsbad |
92010 |
4 |
11 |
| SW Carlsbad |
92011 |
4 |
19 |
| Carmel Valley |
92130 |
25 |
38 |
| Del Mar |
92014 |
32 |
25 |
| Encinitas |
92024 |
36 |
48 |
| La Jolla |
92037 |
95 |
45 |
| RSF |
67+91 |
87 |
50 |
| Solana Beach |
92075 |
8 |
9 |
| NSDCC |
All Above |
336 |
331 |
| West RB |
92127 |
24 |
63 |
| Scripps Ranch |
92131 |
6 |
25 |
What can buyers do?
Going inland doesn’t help – the 92127 and 92131 are hotter than ever.
Just go up in price – La Jolla is nice this time of year!
We will re-visit these numbers in the coming months.
by Jim the Realtor | Feb 23, 2021 | Actives/Pendings, Jim's Take on the Market, Market Buzz, Market Conditions, Market Surge, North County Coastal, NSDCC Pendings, Spring Kick |
This morning we have more homes in escrow than we have for sale!
NSDCC Detached-Home Listings
| Listing Status |
# of Listings |
Median List Price |
| Active |
352 |
$3,950,000 |
| Pending |
353 |
$1,925,000 |
Once upon a time I was discussing the actives/pendings relationship with local agent Peter B. He agreed that a 2:1 ratio of actives to pendings was a sign of a healthy market. If 2:1 was healthy, what is 1:1?
One thing that’s happening is that the action is rising into the upper price ranges. Today we have 94 homes in escrow that are priced over $3,000,000, which I doubt we’ve ever had before.
If we don’t see a surge of more listings, the pendings could extend its lead in the coming days/weeks!
~~~~~~~~~~~~~~~~~~~~~~~~~~~~~~~~~~~~
by Jim the Realtor | Feb 12, 2021 | Actives/Pendings, Market Surge, North County Coastal, NSDCC Pendings |
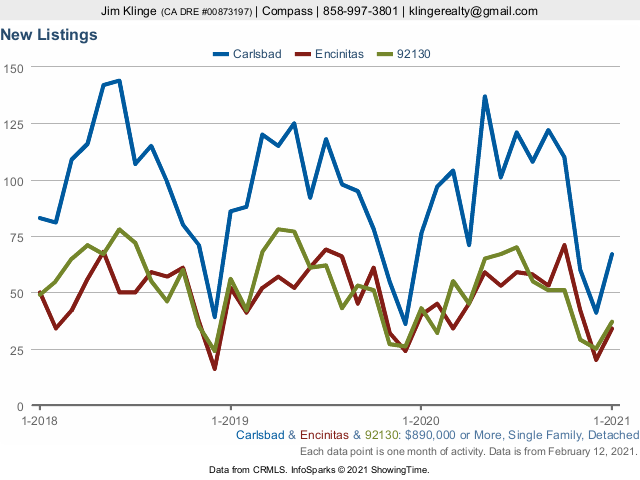
When you look at the general data, the 25% dip year-over-year of January listings doesn’t look so bad – especially on a graph. Heck, we’re in the middle of a pandemic!
But look how it is playing out:
NSDCC Detached-Home New Listings
| Price Range |
New Listings in January |
# of Those Pend/Sold |
Pend/Sold Median DOM |
| Under $1.5M |
85 |
75 |
5 |
| Over $1.5M |
189 |
98 |
6 |
The lower-end is smoking hot where virtually all listings have found a buyer (88%), and for the higher-end to have most of the January listings go pending already is astonishing!
This has to be the best performing market of all-time!
~~~~~~~~~~~~~~~~~~~~
by Jim the Realtor | Feb 2, 2021 | 2021, Actives/Pendings, Bidding Wars, Frenzy, Market Buzz, Market Conditions |
Historically the market has felt healthy and balanced when we’ve had a 2:1 ratio of actives vs. pendings.
Remember when the Ranch was 10:1 for years? Now look at the market – especially on the lower-end:
NSDCC Actives and Pendings
| Town or Area |
Zip Code |
Actives |
Pendings |
| Cardiff |
92007 |
11 |
16 |
| NW Carlsbad |
92008 |
17 |
19 |
| SE Carlsbad |
92009 |
9 |
38 |
| NE Carlsbad |
92010 |
1 |
12 |
| SW Carlsbad |
92011 |
2 |
17 |
| Carmel Valley |
92130 |
26 |
43 |
| Del Mar |
92014 |
43 |
13 |
| Encinitas |
92024 |
39 |
45 |
| La Jolla |
92037 |
101 |
46 |
| RSF |
92067 |
96 |
35 |
| Solana Beach |
92075 |
11 |
10 |
| NSDCC |
All Above |
356 |
294 |
Carlsbad, a town of 110,000+ people, has 29 houses for sale?
It’s probably going to get crazier too as the traditional selling season opens up and we see a few more listings trickle out. It would take a flood of new listings to cause the market to slow down now.
~~~~~~~~~~~~~~~~~~~~~~~~~~~~~~~~
by Jim the Realtor | Aug 17, 2020 | Actives/Pendings, Inventory, Jim's Take on the Market, NSDCC Pendings
In previous years, the action is winding down by mid-August.
Not this year!
We’ve seen more pendings than actives in the lower price ranges. This week it happened for the first time in the $1,500,000 – $2,000,000 range:
NSDCC Actives and Pendings
| Price Range |
Active Listings |
Avg. LP/sf |
Pending Listings |
Avg LP/sf |
| $0-$1.0M |
28 |
$533/sf |
67 |
$506/sf |
| $1.0M-$1.5M |
113 |
$608/sf |
158 |
$518/sf |
| $1.5M-$2.0M |
123 |
$714/sf |
126 |
$630/sf |
| $2.0M-$3.0M |
137 |
$823/sf |
87 |
$729/sf |
Let’s note the differences.
Last year at this time, we had 199 actives and 79 pendings between $1,500,000 – $2,000,000.
On June 1st, we had 162 actives and 76 pendings.
Now it’s 123 vs. 126!
(more…)
by Jim the Realtor | Jul 2, 2020 | Actives/Pendings, Jim's Take on the Market, North County Coastal, NSDCC Pendings
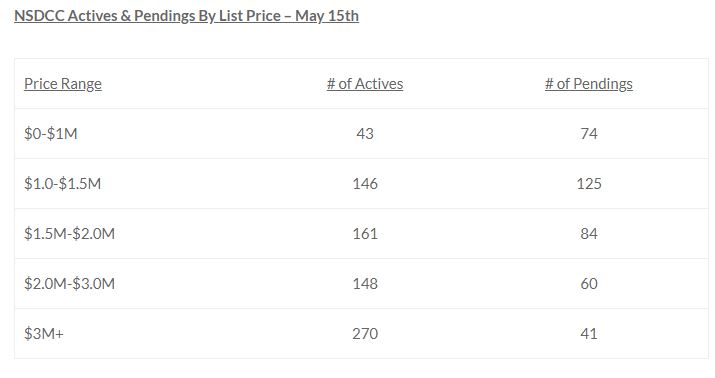
We saw those fancy graphs yesterday that compared the San Diego region to others nearby, and it appeared that the markets have slowed slightly. But let’s isolate on the La Jolla-to-Carlsbad area.
The chart above is from May 15th – here are the same categories today:
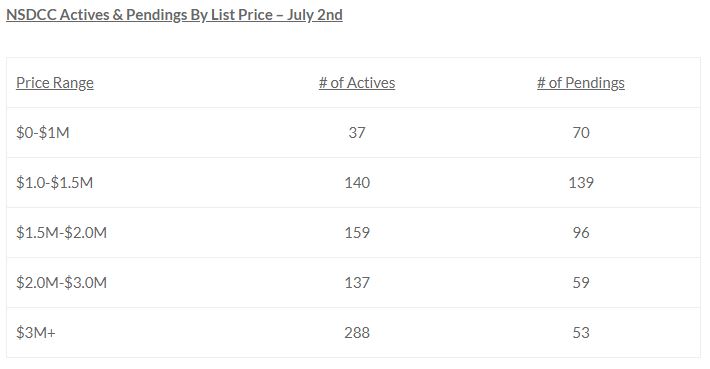
No slowdown here, especially in the $1.0M to $2.0M range where we have 26 more pendings today than we had 2.5 weeks ago. How about the additional 12 pendings in the $3.0M+ range?
by Jim the Realtor | Jul 1, 2020 | Actives/Pendings, Graphs of Market Indicators, Jim's Take on the Market, Market Surge, Virus |
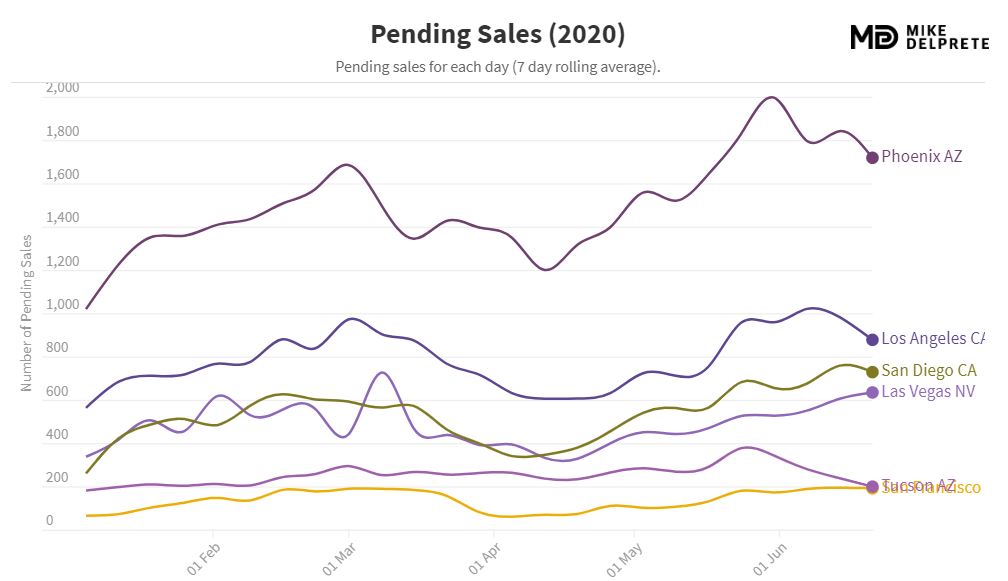
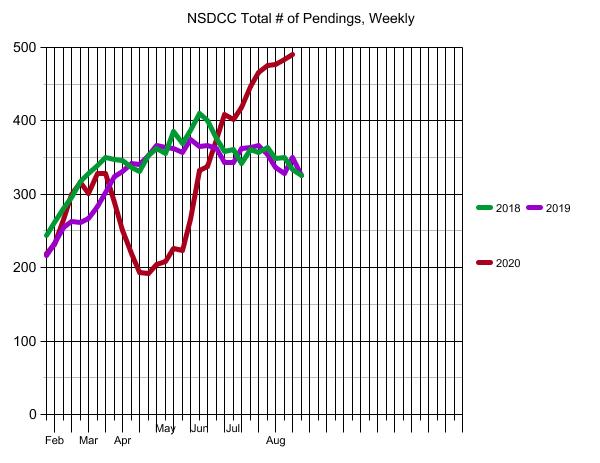
The graph above shows the raw data – how the pendings started to increase as we got into April. It seemed like the action began to slow down just recently, and, sure enough, the rolling averages have been in decline over the last week or two in San Diego – and elsewhere.
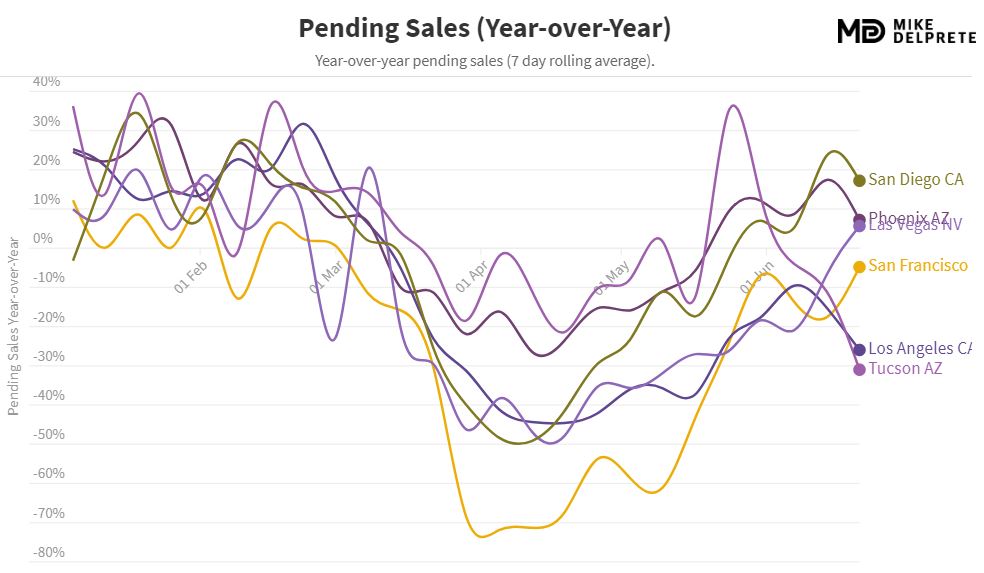
If you just need some covid relief, then the graph below will make you feel better. For the last month, the pending sales in San Diego have been comfortably ahead of last year’s counts.
https://www.mikedp.com/