by Jim the Realtor | Apr 17, 2024 | Actives/Pendings, Jim's Take on the Market |
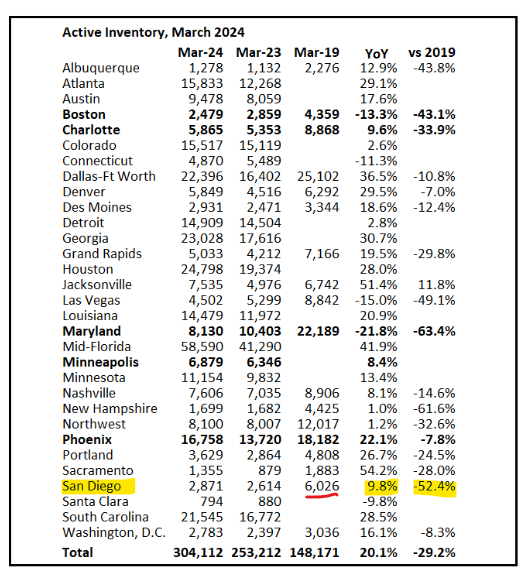
There isn’t as much fluff as we used to have in the pre-pandemic days.
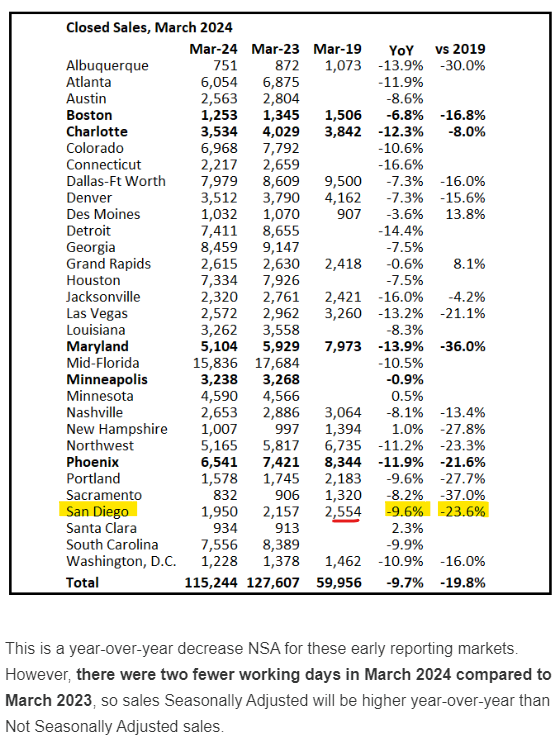
In March 2019, there were 6,026 homes for sale, but only 2,554 sold, which means there were lots of sellers and agents on the open market who were in price-discovery mode – and they found out what the market wouldn’t bear.
We’re heading back that way again.
For the last three years, we’ve been spoiled by maximum demand (caused by low inventory combined with low rates). But now that both are creeping upward, there will be sellers/agents who are overly-optimistic and don’t factor the negative impact into their equation.
Last month’s ratio of 2,871/1,950 = 1.47 is still better than the 2019 numbers of 6,026/2,554 = 2.36, but don’t be surprised to see an upward trend of unsold listings forming over the next few months.
by Jim the Realtor | Jul 21, 2022 | 2022, Actives/Pendings, Frenzy, Frenzy Monitor, North County Coastal, NSDCC Pendings |
The reason for breaking down the active and pending listings by zip code is to give the readers a closer look at their neighborhood stats.
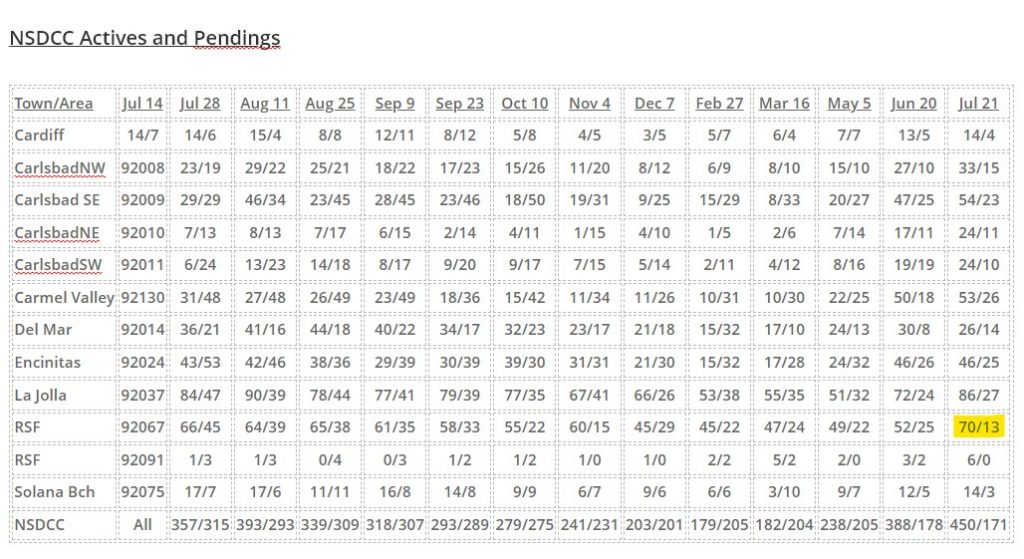
In the recent years prior to the pandemic, the actives/pendings in Rancho Santa Fe ran at a 10:1 pace. Nobody is in a hurry there, they don’t have to sell, and they’re not going to give it away. Those days appear to be coming back.
The median list price of those RSF actives is $5,995,000 – is anyone going to feel sorry for them? Probably not. Does it reflect what is going on in the rest of the area? Not really – the other areas are mostly around a 2:1 ratio (except La Jolla) which has been our standard for a healthy market and pretty good, all considered.
In 2020, we had 400+ pendings from June 22nd to November 30th – with a peak of 491 pendings on September 7, 2020.
by Jim the Realtor | Jun 20, 2022 | Actives/Pendings, Frenzy Monitor, North County Coastal, NSDCC Pendings |
Let’s break down the active and pending listings by zip code is to give you a closer look at the neighborhood stats. We’re going to have more active listings simply because the the list prices were all based on red-hot frenzy conditions (comps + 5% or more), and we’re past the red-hot days.
NSDCC Actives and Pendings
| Town/Area |
Zip Code |
Feb 27 |
Mar 16 |
May 5 |
Jun 20 |
| Cardiff |
92007 |
5/7 |
6/4 |
7/7 |
13/5 |
| Carlsbad NW |
92008 |
6/9 |
8/10 |
15/10 |
27/10 |
| Carlsbad SE |
92009 |
15/29 |
8/33 |
20/27 |
47/25 |
| Carlsbad NE |
92010 |
1/5 |
2/6 |
7/14 |
17/11 |
| Carlsbad SW |
92011 |
2/11 |
4/12 |
8/16 |
19/19 |
| Carmel Valley |
92130 |
10/31 |
10/30 |
22/25 |
50/18 |
| Del Mar |
92014 |
15/32 |
17/10 |
24/13 |
30/8 |
| Encinitas |
92024 |
15/32 |
17/28 |
24/32 |
46/26 |
| La Jolla |
92037 |
53/38 |
55/35 |
51/32 |
72/24 |
| Rancho Santa Fe |
92067 |
45/22 |
47/24 |
49/22 |
52/25 |
| Rancho Santa Fe |
92091 |
2/2 |
5/2 |
2/0 |
3/2 |
| Solana Bch |
92075 |
6/6 |
3/10 |
9/7 |
12/5 |
| NSDCC |
All Above |
179/205 |
182/204 |
238/205 |
388/178 |
The selling season started early in 2022, and was cooking by the end of February. Let’s group the different areas based on how their pendings are holding up.
Frenzy-ish:
Carlsbad SW – A few houses finally went up for sale, and buyers responded.
Rancho Santa Fe – The active listings aren’t growing like in the other high-end areas of Del Mar and La Jolla, and the number of pendings are very impressive. It was once normal when the Ranch had a 10:1 ratio between actives and pendings!
Normal-ish:
Everyone else, except……
Crash Zone
Carmel Valley – which has always had more pendings than actives over the last two years – and sometimes twice as many pendings! While having 50 actives and 18 pendings anywhere else would be a win, in the CV it feels like a meltdown.
Here they are:
(I tried to sort those by price order, but all they have is sort by date added)
~~~~~~~~~~~~~~~~~~~~~~~~~~~~~~~~~~~~~~~~~~~~~~~~~~~~~~~~~~~~~~~~~~~~~~~
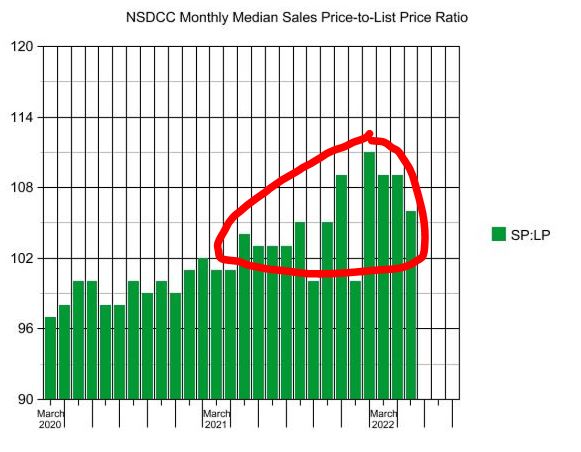
This nonsense about every buyer paying way over list price has to stop. If the SP:LP was around 100% we’d be elated, yet it was 111%, 109%, and 109% in the February-April stretch.
So far in June, the SP:LP is 107% for the 104 detached-home sales between Carlsbad and La Jolla!
~~~~~~~~~~~~~~~~~~~~~~~~~~~~~~~~~~~~~~~~~~~~~~~~~~~~~~~~~~~~~~~~~~~~
We can also track the average market times too. Any upward trends here would indicate market slowing – it’s early so nothing too startling yet:
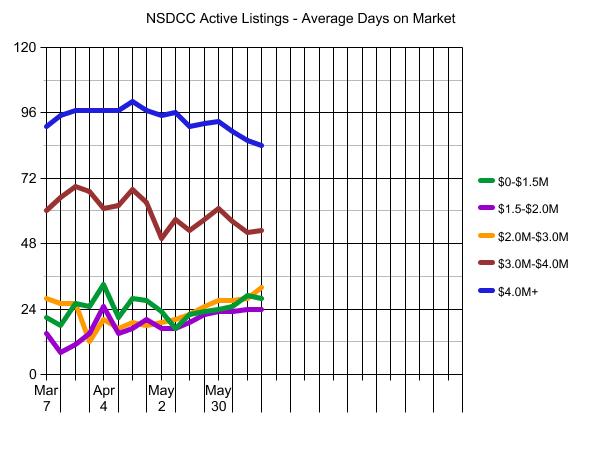
The hottest of the red-hot was in 2020, when we had 400+ pendings from June 22nd to November 30th – with a peak of 491 pendings on 9/7/2020. Today we have 178 pendings.
by Jim the Realtor | Jun 20, 2022 | Actives/Pendings, Inventory, North County Coastal |
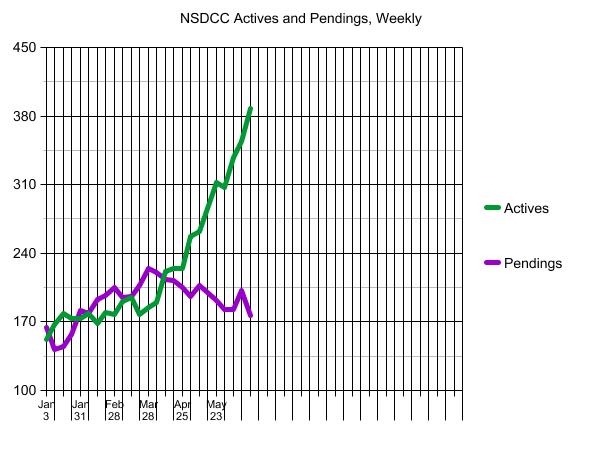
Buyers thought this was a holiday weekend, and sellers didn’t!
It was the week that the actives-to-pendings ratio between La Jolla and Carlsbad crossed back over the ideal 2:1 range, which is what we have observed to be the sign of a healthy market in the past.
Last week: 354/202, or 1.75
This week: 388/177, or 2.19
Here is the breakdown by price range:
NSDCC Actives and Pendings
| Price Range |
Active Listings |
Pending Listings |
A/P |
| 0-$1.5M |
46 |
22 |
2.1 |
| $1.5-$2.0M |
57 |
41 |
1.4 |
| $2.0-$3.0M |
91 |
59 |
1.5 |
| $3.0-$4.0M |
52 |
26 |
2.0 |
| $4.0M+ |
148 |
35 |
4.2 |
The high-end firmly believes that it takes longer to sell the uber-expensive homes, so they are happy to wait for their magic moment – and typically have the resources to do so.
I wrote offers for buyers around the $2,000,000 range, and both listing agents claimed to have multiple offers. It may take longer to reach an accepted offer these days as listing agents wait for better deals to arrive, so let’s check back on the pendings in a couple of days.
This is what Plateau City looks like – plenty of unsolds preferring to sit, than reduce.
~~~~~~~~~~~~~~~~~~~~~~~~~~~~~~~~~~~
The $0 – $1,500,000 Market:
| Date |
NSDCC Active Listings |
Avg. LP/sf |
Avg. DOM |
# of Pendings |
| Jan 3, 2022 |
9 |
$832/sf |
35 |
36 |
| Jan 10 |
9 |
$766/sf |
28 |
29 |
| Jan 17 |
13 |
$773/sf |
26 |
27 |
| Jan 24 |
9 |
$818/sf |
15 |
29 |
| Jan 31 |
14 |
$752/sf |
14 |
31 |
| Feb 7 |
13 |
$774/sf |
12 |
32 |
| Feb 14 |
11 |
$826/sf |
12 |
35 |
| Feb 21 |
7 |
$889/sf |
17 |
38 |
| Feb 28 |
12 |
$888/sf |
17 |
33 |
| Mar 7 |
9 |
$1,017/sf |
21 |
33 |
| Mar 14 |
14 |
$847/sf |
18 |
31 |
| Mar 21 |
8 |
$912/sf |
26 |
36 |
| Mar 28 |
10 |
$914/sf |
25 |
28 |
| Apr 4 |
10 |
$782/sf |
33 |
34 |
| Apr 11 |
19 |
$733/sf |
21 |
36 |
| Apr 18 |
16 |
$795/sf |
28 |
34 |
| Apr 25 |
18 |
$891/sf |
27 |
30 |
| May 2 |
22 |
$822/sf |
23 |
31 |
| May 9 |
24 |
$887/sf |
17 |
46 |
| May 16 |
25 |
$783/sf |
22 |
25 |
| May 23 |
29 |
$782/sf |
23 |
29 |
| May 30 |
30 |
$782/sf |
24 |
28 |
| Jun 6 |
34 |
$763/sf |
25 |
28 |
| Jun 13 |
33 |
$802/sf |
29 |
29 |
| Jun 20 |
48 |
$774/sf |
28 |
22 |
The $1,500,000 – $2,000,000 Market:
| Date |
NSDCC Active Listings |
Avg. LP/sf |
Avg. DOM |
# of Pendings |
| Jan 3, 2022 |
8 |
$842/sf |
52 |
36 |
| Jan 10 |
13 |
$751/sf |
28 |
29 |
| Jan 17 |
16 |
$736/sf |
33 |
27 |
| Jan 24 |
16 |
$801/sf |
17 |
27 |
| Jan 31 |
15 |
$696/sf |
14 |
34 |
| Feb 7 |
15 |
$765/sf |
17 |
34 |
| Feb 14 |
10 |
$726/sf |
19 |
38 |
| Feb 21 |
19 |
$715/sf |
15 |
39 |
| Feb 28 |
9 |
$660/sf |
12 |
46 |
| Mar 7 |
16 |
$789/sf |
15 |
46 |
| Mar 14 |
17 |
$837/sf |
8 |
44 |
| Mar 21 |
18 |
$867/sf |
11 |
43 |
| Mar 28 |
14 |
$838/sf |
15 |
48 |
| Apr 4 |
18 |
$762/sf |
25 |
42 |
| Apr 11 |
23 |
$774/sf |
15 |
39 |
| Apr 18 |
22 |
$792/sf |
17 |
41 |
| Apr 25 |
18 |
$810/sf |
20 |
41 |
| May 2 |
27 |
$809/sf |
17 |
37 |
| May 9 |
33 |
$837/sf |
17 |
46 |
| May 16 |
39 |
$793/sf |
19 |
44 |
| May 23 |
43 |
$793/sf |
22 |
44 |
| May 30 |
36 |
$843/sf |
23 |
36 |
| Jun 6 |
43 |
$817/sf |
23 |
41 |
| Jun 13 |
49 |
$845/sf |
24 |
42 |
| Jun 20 |
57 |
$817/sf |
24 |
41 |
The $2,000,000 – $3,000,000 Market:
| Date |
NSDCC Active Listings |
Avg. LP/sf |
Avg. DOM |
# of Pendings |
| Jan 3, 2022 |
18 |
$1,080/sf |
127 |
43 |
| Jan 10 |
23 |
$1,038/sf |
85 |
37 |
| Jan 17 |
26 |
$1,044/sf |
80 |
41 |
| Jan 24 |
28 |
$1,015/sf |
37 |
42 |
| Jan 31 |
22 |
$949/sf |
38 |
47 |
| Feb 7 |
26 |
$919/sf |
29 |
42 |
| Feb 14 |
22 |
$997/sf |
37 |
49 |
| Feb 21 |
21 |
$966/sf |
33 |
54 |
| Feb 28 |
26 |
$905/sf |
32 |
57 |
| Mar 7 |
29 |
$922/sf |
28 |
57 |
| Mar 14 |
20 |
$852/sf |
26 |
58 |
| Mar 21 |
17 |
$928/sf |
26 |
60 |
| Mar 28 |
34 |
$927/sf |
12 |
65 |
| Apr 4 |
32 |
$927/sf |
20 |
69 |
| Apr 11 |
44 |
$910/sf |
17 |
62 |
| Apr 18 |
48 |
$997/sf |
19 |
66 |
| Apr 25 |
42 |
$1,092/sf |
18 |
73 |
| May 2 |
54 |
$995/sf |
19 |
70 |
| May 9 |
61 |
$910/sf |
20 |
73 |
| May 16 |
64 |
$977/sf |
22 |
69 |
| May 23 |
82 |
$953/sf |
25 |
59 |
| May 30 |
78 |
$951/sf |
27 |
56 |
| Jun 6 |
94 |
$963/sf |
27 |
58 |
| Jun 13 |
98 |
$961/sf |
28 |
70 |
| Jun 20 |
91 |
$935/sf |
32 |
59 |
The $3,000,000 – $4,000,000 Market:
| Date |
NSDCC Active Listings |
Avg. LP/sf |
Avg. DOM |
# of Pendings |
| Jan 3, 2022 |
19 |
$1,230/sf |
90 |
26 |
| Jan 10 |
22 |
$1,210/sf |
76 |
25 |
| Jan 17 |
19 |
$1,207/sf |
86 |
23 |
| Jan 24 |
17 |
$1,129/sf |
92 |
24 |
| Jan 31 |
21 |
$1,172/sf |
70 |
22 |
| Feb 7 |
19 |
$1,169/sf |
67 |
25 |
| Feb 14 |
19 |
$1,234/sf |
65 |
28 |
| Feb 21 |
21 |
$1,279/sf |
69 |
28 |
| Feb 28 |
22 |
$1,214/sf |
64 |
25 |
| Mar 7 |
27 |
$1,295/sf |
60 |
24 |
| Mar 14 |
27 |
$1,201/sf |
65 |
27 |
| Mar 21 |
23 |
$1,282/sf |
69 |
31 |
| Mar 28 |
25 |
$1,253/sf |
67 |
30 |
| Apr 4 |
30 |
$1,199/sf |
61 |
27 |
| Apr 11 |
32 |
$1,174/sf |
62 |
31 |
| Apr 18 |
33 |
$1,216/sf |
68 |
31 |
| Apr 25 |
33 |
$1,219/sf |
63 |
33 |
| May 2 |
37 |
$1,164/sf |
50 |
36 |
| May 9 |
33 |
$1,132/sf |
57 |
32 |
| May 16 |
40 |
$1,119/sf |
53 |
32 |
| May 23 |
40 |
$1,135/sf |
57 |
27 |
| May 30 |
40 |
$1,178/sf |
61 |
28 |
| Jun 6 |
43 |
$1,224/sf |
56 |
28 |
| Jun 13 |
48 |
$1,184/sf |
52 |
28 |
| Jun 20 |
52 |
$1,117/sf |
53 |
26 |
The $4,000,000+ Market:
| Date |
NSDCC Active Listings |
Avg. LP/sf |
Avg. DOM |
# of Pendings |
| Jan 3, 2022 |
100 |
$1,884/sf |
128 |
30 |
| Jan 10 |
105 |
$1,864/sf |
113 |
29 |
| Jan 17 |
109 |
$1,763/sf |
110 |
34 |
| Jan 24 |
105 |
$2,130/sf |
114 |
42 |
| Jan 31 |
102 |
$2,114/sf |
118 |
53 |
| Feb 7 |
109 |
$2,000/sf |
108 |
50 |
| Feb 14 |
108 |
$2,005/sf |
109 |
47 |
| Feb 21 |
113 |
$2,008/sf |
103 |
43 |
| Feb 28 |
111 |
$1,991/sf |
101 |
47 |
| Mar 7 |
115 |
$1,904/sf |
91 |
39 |
| Mar 14 |
121 |
$1,893/sf |
95 |
43 |
| Mar 21 |
116 |
$1,905/sf |
97 |
44 |
| Mar 28 |
104 |
$1,966/sf |
97 |
59 |
| Apr 4 |
103 |
$1,929/sf |
97 |
56 |
| Apr 11 |
106 |
$1,906/sf |
97 |
55 |
| Apr 18 |
108 |
$1,874/sf |
100 |
51 |
| Apr 25 |
116 |
$1,829/sf |
97 |
38 |
| May 2 |
117 |
$1,781/sf |
95 |
32 |
| May 9 |
116 |
$1,831/sf |
96 |
36 |
| May 16 |
124 |
$1,854/sf |
91 |
39 |
| May 23 |
125 |
$1,855/sf |
92 |
36 |
| May 30 |
129 |
$1,706/sf |
93 |
39 |
| Jun 6 |
131 |
$1,740/sf |
89 |
33 |
| Jun 13 |
132 |
$1,793/sf |
86 |
38 |
| Jun 20 |
148 |
$1,772/sf |
84 |
35 |
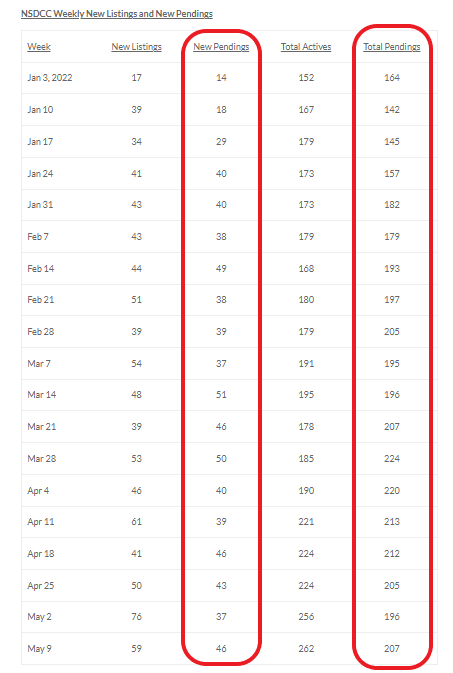
NSDCC Weekly New Listings and New Pendings
| Week |
New Listings |
New Pendings |
Total Actives |
Total Pendings |
| Jan 3, 2022 |
17 |
14 |
152 |
164 |
| Jan 10 |
39 |
18 |
167 |
142 |
| Jan 17 |
34 |
29 |
179 |
145 |
| Jan 24 |
41 |
40 |
173 |
157 |
| Jan 31 |
43 |
40 |
173 |
182 |
| Feb 7 |
43 |
38 |
179 |
179 |
| Feb 14 |
44 |
49 |
168 |
193 |
| Feb 21 |
51 |
38 |
180 |
197 |
| Feb 28 |
39 |
39 |
179 |
205 |
| Mar 7 |
54 |
37 |
191 |
195 |
| Mar 14 |
48 |
51 |
195 |
196 |
| Mar 21 |
39 |
46 |
178 |
207 |
| Mar 28 |
53 |
50 |
185 |
224 |
| Apr 4 |
46 |
40 |
190 |
220 |
| Apr 11 |
61 |
39 |
221 |
213 |
| Apr 18 |
41 |
46 |
224 |
212 |
| Apr 25 |
50 |
43 |
224 |
205 |
| May 2 |
76 |
37 |
256 |
196 |
| May 9 |
59 |
46 |
262 |
207 |
| May 16 |
78 |
48 |
286 |
200 |
| May 23 |
61 |
42 |
312 |
192 |
| May 30 |
54 |
44 |
307 |
183 |
| Jun 6 |
70 |
31 |
338 |
183 |
| Jun 13 |
60 |
41 |
354 |
202 |
| Jun 20 |
71 |
25 |
388 |
177 |
by Jim the Realtor | May 12, 2022 | 2022, Actives/Pendings, Jim's Take on the Market, Market Conditions, Slow Unwind |
Even though real estate is local, the homebuyer psychology tends to be similar across the country – mostly because people are people, and have similar reactions to every variable. When they see mortgage rates go from 3% to 5.5% in less than six months, it’s only natural to want to pause and see where this goes.
But the desperation among buyers – especially those who are out-of-towners and don’t own a home here yet – hasn’t changed, due to the low inventory. It is unsettling to see so few of the quality homes coming to market, and they want/need to stay in the game so they don’t miss out. It would take a flood of new listings to change that, which isn’t happening. At least not yet.
Let’s have the statistics help guide us on current market conditions.
1. We have considered the local real estate market to be ‘healthy’ when the active listings to pendings has been 2:1 ratio. Here are the detached-home listings between Carlsbad and La Jolla:
Monday:
Actives: 262
Pendings: 207
Thursday (today):
Actives: 262
Pendings: 202
The current ratio is very healthy, and the actives aren’t exploding. Last year at this time there were 330 active listings, so only having 262 homes for sale in an area with a population of 300,000+ people isn’t bad. The only startling part is that there aren’t more homes for sale!
~~~~~~~~~~~~~~~~~~~~~~~~~~~~~~~~~~~~~~~~~~~~~~~~~~~~~~~~~~~~~~~~~~~
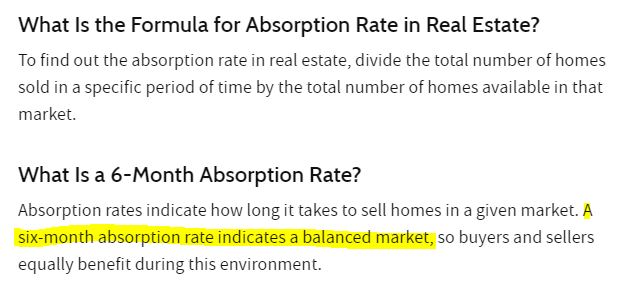
2. Let’s talk absorption rate, another measuring stick for the health of the market. The historic norm for a healthy market has been a 6-months’ supply of homes for sale. In recent years, a 3-month supply has seemed to be more realistic, just because the supply has been limited.
What is it today?
There were 225 sales in April, so the 262 active listings is only a 1.2-month supply. We would need 675 active listings to have a three-month supply, which sounds impossible in the current environment.
~~~~~~~~~~~~~~~~~~~~~~~~~~~~~~~~~~~~~~~~~~~~~~~~~~~~~~~~~~~~~~~~
3. How about the market time of the current pendings? Is it taking longer to find a buyer these days? Yes. The median days-on-market for homes sold in the early months of 2022 has been nine days. The current pendings have a median days-on market of 12 days, which isn’t alarming and still extremely low.
~~~~~~~~~~~~~~~~~~~~~~~~~~~~~~~~~~~~~~~~~~~~~~~~~~~~~~~~~~~~~~~~
4. Have the number of actives and pendings been consistent in 2022?
Yes, especially the pendings:
So while there is talk about a shift in the market, it may just be a pause. Statistically, the market looks steady – there isn’t a surge of unsold homes, and there are still plenty going into escrow every week.
If there aren’t as many buyers looking, and there aren’t crazy numbers of offers, then it’s just going back to a more-normal market. Not normal yet, but heading that way.
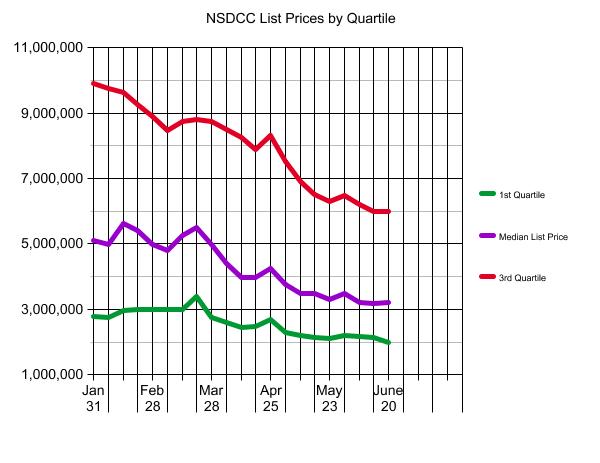
The list prices have been on a rampage, and it’s probably time for them to stop going up so much every month. It was going to happen sooner or later, and that day has probably arrived – finally!
by Jim the Realtor | May 5, 2022 | Actives/Pendings, Market Conditions |
The talking heads are saying that higher rates are slowing sales, and I say it’s the lack of inventory.
If higher rates were the cause, we would see more active listings piling up.
This chart shows how the pendings have dropped off from last year – especially those in yellow:
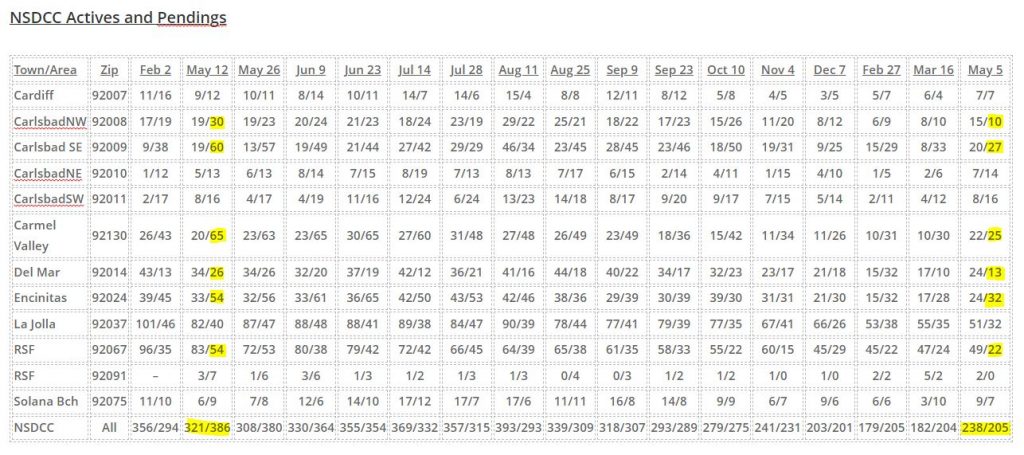
The active-listing counts aren’t any higher – there are just fewer listings overall.
by Jim the Realtor | Mar 16, 2022 | Actives/Pendings, Frenzy Monitor |
Let’s see which areas are picking up steam early in the selling season:
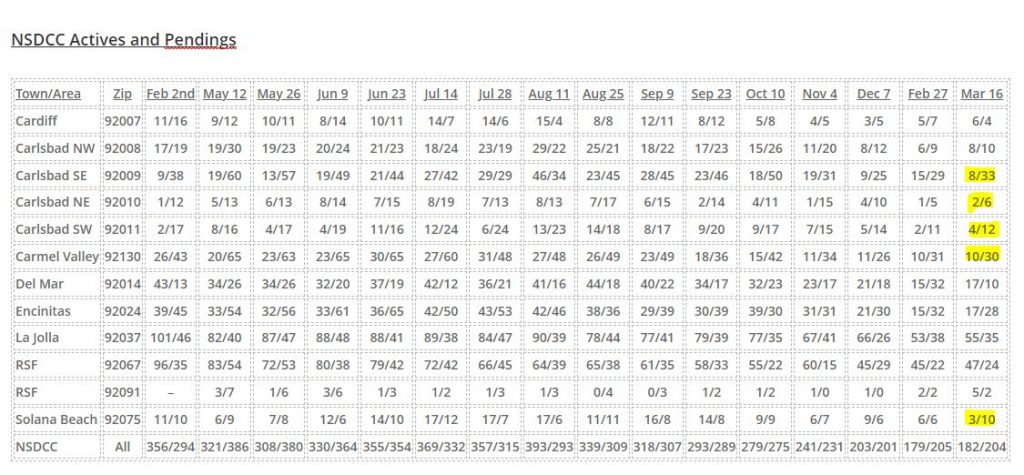
We used to think that a normal and healthy market has a ratio of 2:1 actives to pendings, so it’s stunning to see five areas that have 3x the number of pendings as actives! And SE Carlsbad has more than 4x!
The trend of the average days-on-market can give us a feel for the market direction too:
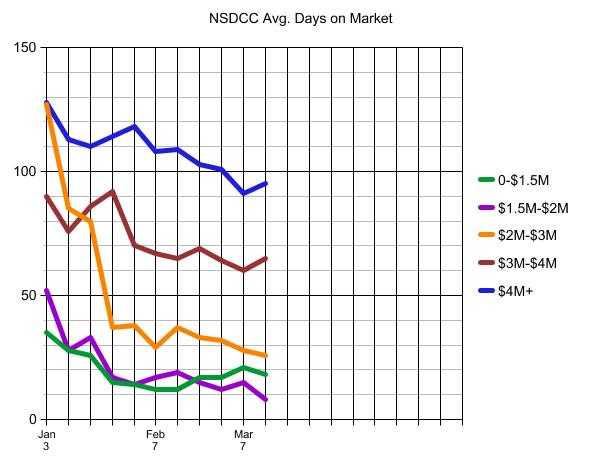
In 2020, we had 400+ pendings from June 22nd to November 30th – with a peak of 491 pendings on September 7, 2020.
Last year, the high pending count was 386 on May 12th – and this year’s peak will likely be in May too.
It looks like I made an error on the Del Mar A/P counts in the last reading.
by Jim the Realtor | Feb 27, 2022 | 2022, Actives/Pendings, Frenzy, Frenzy Monitor |
It’s the end of February, yet we’re not close to having the same market as last February.
Heck, we’re fighting to get back to December’s numbers:
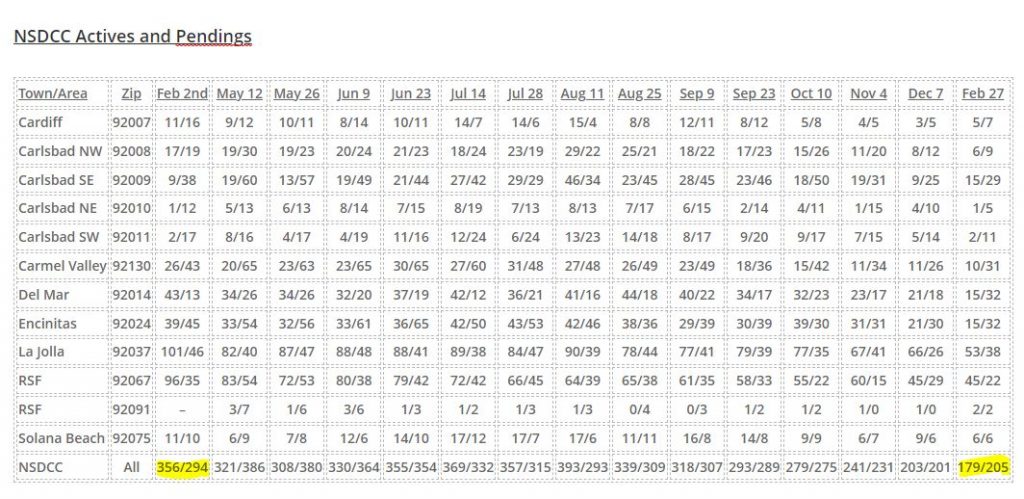
Did you ever think we’d be hoping to just get back to having the same market as in 2021?
by Jim the Realtor | Dec 30, 2021 | 2021, Actives/Pendings, Sales and Price Check |
Tom asked on our Facebook page about getting the actives and pendings data for San Diego County. Here is the InfoSparks data from the SDAR Resources page on the MLS – they are interactive so scroll over the graph lines for the exact counts:
The first graph charts the number of active listings on the last day of the month, the second graph shows the number of new listings in each month, the third graph shows the number of properties that were marked ‘pending’ in each month, and the fourth is the actual sales counts each month.
My initial reactions to each graph:
Active Listings: The frenzy let up in June/July, but it’s back now – and the last few months have been brutal for buyers. On the last day of November, 2019 we had 4,068 actives, and last month we had 1,420.
New Listings: Hard to grasp the cumulative effect so I calculated annual number of listings. In 2021 we have had 16% fewer listings than in 2018.
Pending Sales: This November’s count was almost identical to last year – which was the all-time high!
Sold Listings: The total number of sales for the year is 9% ahead of last year, and we’re not done yet!
by Jim the Realtor | Sep 23, 2021 | 2021, Actives/Pendings, Frenzy, Frenzy Monitor |
The reason for breaking down the active and pending listings by zip code is to give the readers a closer look at their neighborhood stats.
It’s interesting to see that the total number of actives and pendings are so similar – as close as they were in late-June as the max frenzy was unwinding. The big split in the counts on August 11th made it look like the frenzy was coming apart, but they’ve gotten back in line nicely since:
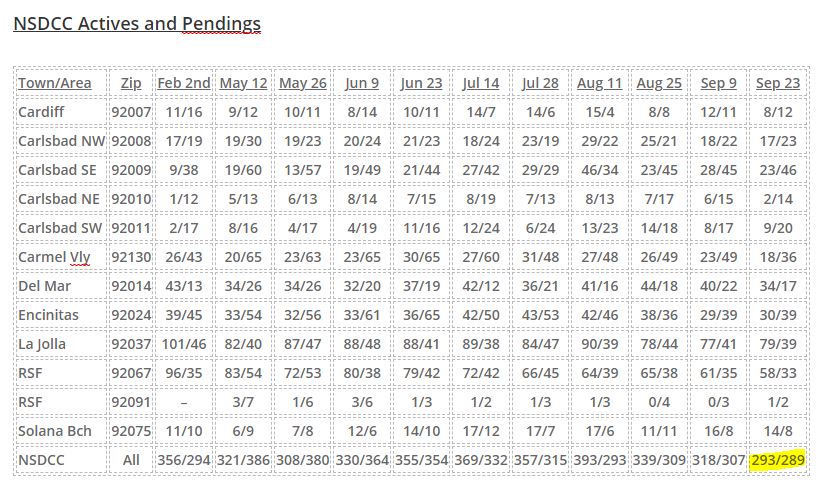
But with fewer homes for sale combined with the time of year, we probably won’t see much change. Let’s call it low-grade frenzy conditions for now.
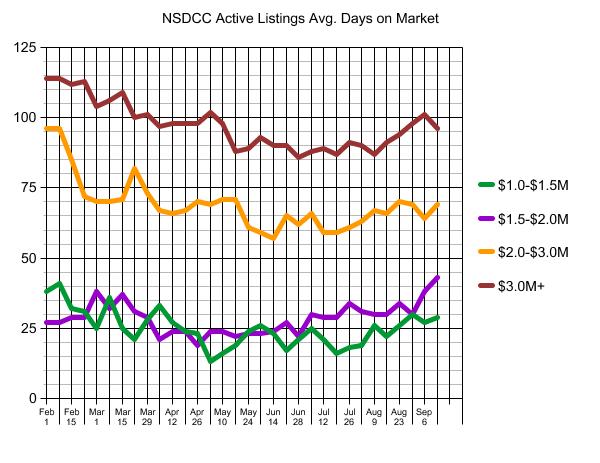
The average days on market is creeping upward, but still no big concerns. There will always be sellers who would rather wait for the lucky sale, than adjust their price – and longer average market times indicate more sellers doing the former. Though we should note that the hottest range ($1.5 – $2.0) must have a lot of dogs lying around:
San Diego County has experienced the worst YoY change of active listings IN THE NATION. Three thousand houses for sale in a county of 3.3 million people? Yikes!!
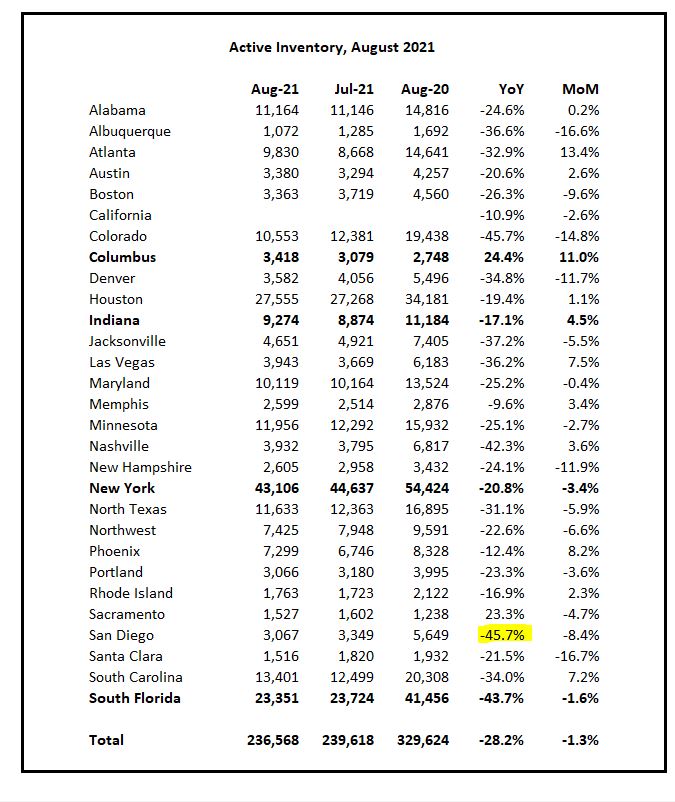
And that was the August report. Today in San Diego County:
ACTIVES: 1,760
PENDINGS: 2,600
Wow!


