
I was so giddy yesterday about dropping rates that the latest Case-Shiller Index didn’t cross my mind. Our doomer guy jumped on the sixth consecutive decline above, but that was when we were nearing 5% mortgage rates and full market stall-out. Now that the sub-4% punch bowl is back, we should see the usual six months of increases begin again with the next reading:
San Diego Non-Seasonally-Adjusted CSI changes:
| Reporting Month | |||
| January ’17 | |||
| February | |||
| March | |||
| April | |||
| May | |||
| June | |||
| Jul | |||
| Aug | |||
| Sept | |||
| Oct | |||
| Nov | |||
| Dec | |||
| January ’18 | |||
| February | |||
| March | |||
| April | |||
| May | |||
| Jun | |||
| Jul | |||
| Aug | |||
| Sept | |||
| Oct | |||
| Nov | |||
| Dec | |||
| Jan |
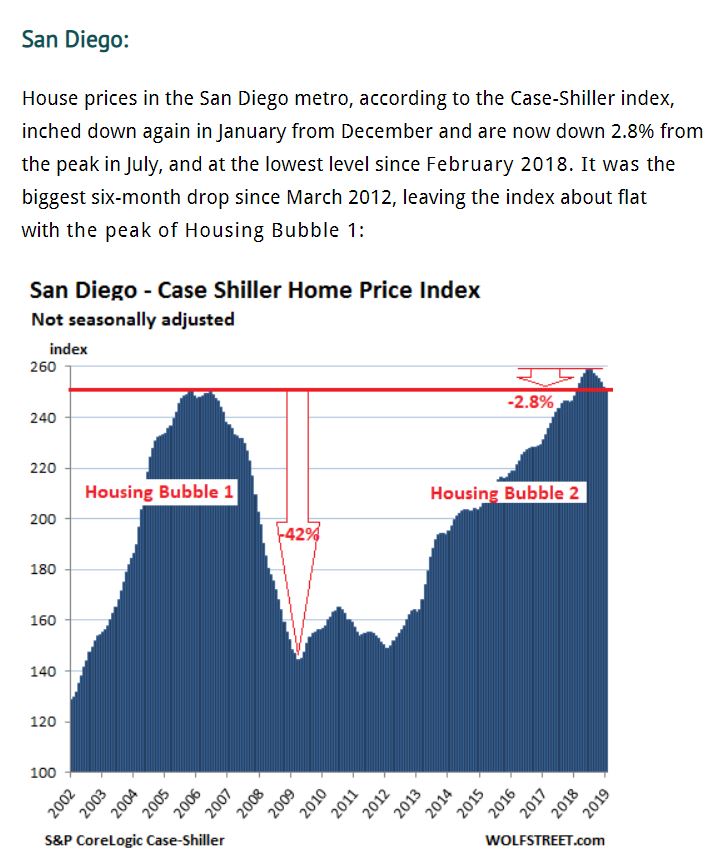
The 2.8% drop over the last six months is nothing but a flesh wound – sellers aren’t going to panic until there are big chunks of decline per month. The previous peak was 250.34 in November, 2005 – about where we are today!


So we are currently in a bubble #2.?
No its the same bubble. The decline in 2007 was a bear trap.
Bubble 1.0 was just reflated by loan mods, bank rule changes, low/no foreclosures, people squatting in the homes and not making any payments for years, etc.
Federal debt is over $22 Trillion. Student loan debt is over $1.5 Trillion, credit card/revolving debt is $1.04 Trillion, auto loan debt is $1.14 Trillion
The Fed had to bring back the punch bowl to the market.
It’s not looking good out there. The time to hunker down and prepare for whatever’s coming is almost past due!