
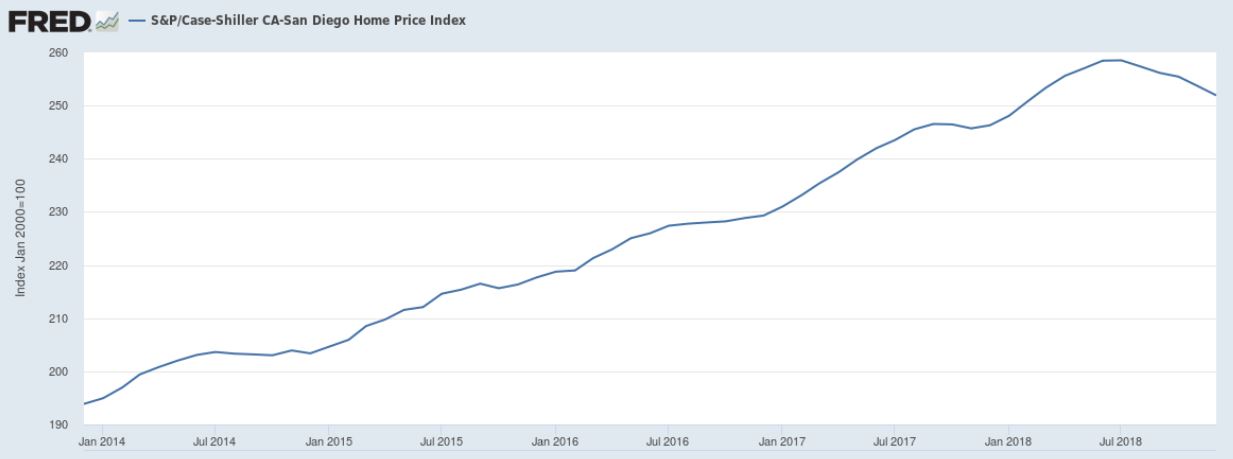
We are back to more-normal appreciation levels now. After dropping for the last six months in a row, the non-seasonally-adjusted Case-Shiller Index for San Diego is just +2.3% year-over-year.
In the graph above, you can see how the index goes up about ten points in the first half of every year, but then pricing tapers off. Last year, the tapering started earlier, and was more pronounced.
It makes you wonder what will happen in 2019? The same? Or worse? It won’t be better unless mortgage rates slip under 4%.
San Diego Non-Seasonally-Adjusted CSI changes:
| Reporting Month | |||
| January ’17 | |||
| February | |||
| March | |||
| April | |||
| May | |||
| June | |||
| Jul | |||
| Aug | |||
| Sept | |||
| Oct | |||
| Nov | |||
| Dec | |||
| January ’18 | |||
| February | |||
| March | |||
| April | |||
| May | |||
| Jun | |||
| Jul | |||
| Aug | |||
| Sept | |||
| Oct | |||
| Nov | |||
| Dec |
The previous peak was 250.34 in November, 2005 – about where we are today!
“Slower price appreciation coupled with lower mortgage rates in 2019 should help homebuyers who haven’t been priced out of the market,” said Danielle Hale, chief economist at Realtor.com. “While 2018 started with a real estate frenzy and ended with a fizzle, we could see 2019’s slow beginning start to pick up later in the year.”


This is mostly good news. Some of us remember when “trees were growing to the sky” and do not wish to relive the consequences.
Still. +3% yoy on a $1.5m home is $45,000 or $250/mo more in the monthly “nut” and$9,000 more in the down payment. If interest rates are higher add that in.
3% inflation is a reasonable middle ground between official inflation and “as seen on the ground inflation”.
Owning residential real estate continues to be a path to greater wealth.