
Here are the stats for the NSDCC detached-home market (La Jolla to Carlsbad):
| Reading Date | ||||
| Oct 28, 2015 | ||||
| Feb 1, 2016 | ||||
| Mar 23, 2016 | ||||
| June 21, 2016 | ||||
| Aug 17, 2016 | ||||
| Dec 4, 2016 | ||||
| Apr 21, 2017 | ||||
| July 16, 2018 | ||||
| Oct 28, 2018 |
NSDCC Actives Median Price = $2,250,000
NSDCC Pendings Median Price = $1,399,000
Only 12% of the actives are under $1,000,000, and 33% are over $3,000,000 (was 10% and 35% last reading). You could say pricing has slid down 2% since July, but pricing stats are just good for trend-watching over the long haul.
The 3.31 ratio is the highest on the chart, and if it was due to an explosion of active (unsold) listings, it would be more troubling. If more homeowners were nervous, we’d see a higher total of listings today, instead of waiting for spring.
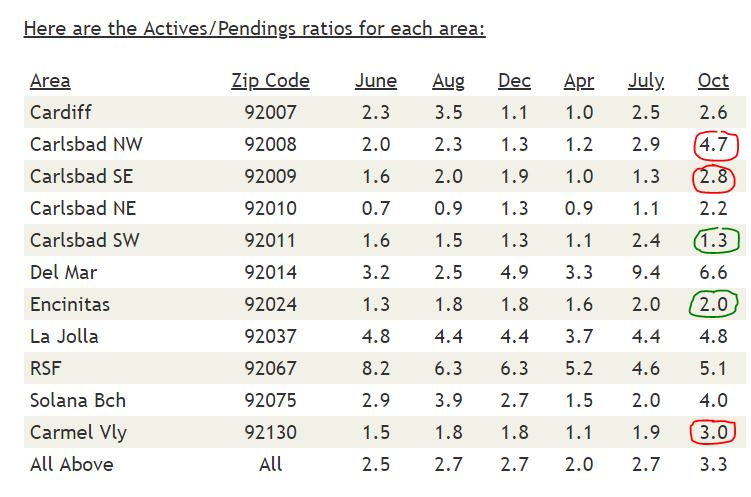
The areas in red have had prices go up too fast, and sellers are holding out.
Areas circled in green are active and healthy.
The Del Mar and Solana Beach samples are smaller and will be more volatile.


