
- The share of homes selling above asking price edged up from 27 percent a year ago to 28 percent in October. Conversely, the share of properties selling below asking price dropped to 44 percent from 47 percent in October 2015. The remaining 28 percent sold at asking price, up from 25 percent in October 2015.
- For homes that sold above asking price, the premium paid over asking price rose to 9.1 percent, up from 7.7 percent in September and 8.9 percent a year ago.
- The 44 percent of homes that sold below asking price sold for an average of 8.9 percent below asking price in October, the lowest since May 2015. The premium paid in both September and a year ago was 12 percent.
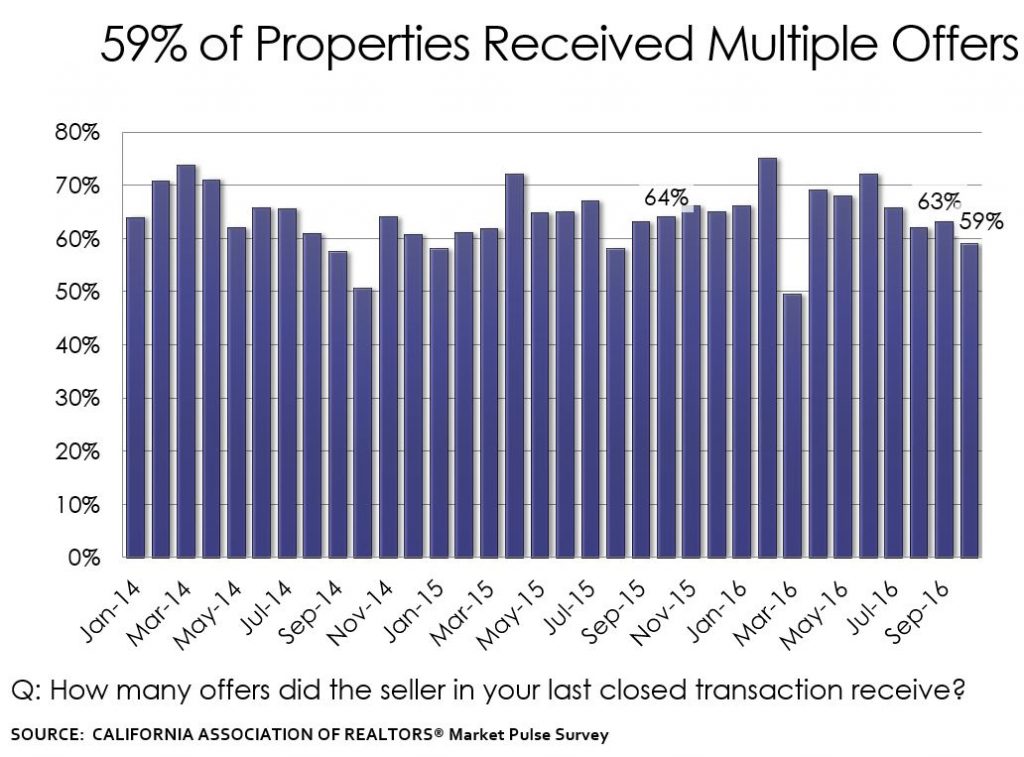
- Nearly six in 10 properties for sale (59 percent) received multiple offers in October, down from 63 percent in September and 64 percent from October 2015. October marked the seventh straight month of declining multiple offers.
- The share of properties receiving three or more offers fell to 30 percent, the lowest level since the beginning of this year. Thirty-five percent of properties received three or more offers in September, and 36 percent of properties received three or more offers a year ago.
- Compared to a year ago, there was an increase in the share of homes receiving three or more offers in homes priced $400,000 to $499,000 and $2 million and higher, while the share of low- to mid-priced homes experienced a decrease in three or more offers, particularly in homes priced $300,000 to $399,000, which dropped the sharpest – from 43 percent in October 2015 to 18 percent in October 2016.
- About a third (31 percent) of properties had listing price reductions in October, up from 25 percent in September and down from 32 percent in October 2015.
- Nearly half (45 percent) of REALTORS® were concerned about high home prices and housing affordability, while 26 percent indicated they were concerned about a lack of available homes for sale. REALTORS® also were concerned about a slowdown in economic growth, lending and financing, rising interest rates, and policy and regulations.
- REALTORS®’ optimism of market conditions over the next year has been trending downward for the past few months but is still in positive territory at an index of 54 in October, unchanged from September but down from 57 in October 2015.
http://www.car.org/newsstand/newsreleases/2016releases/oct2016pending
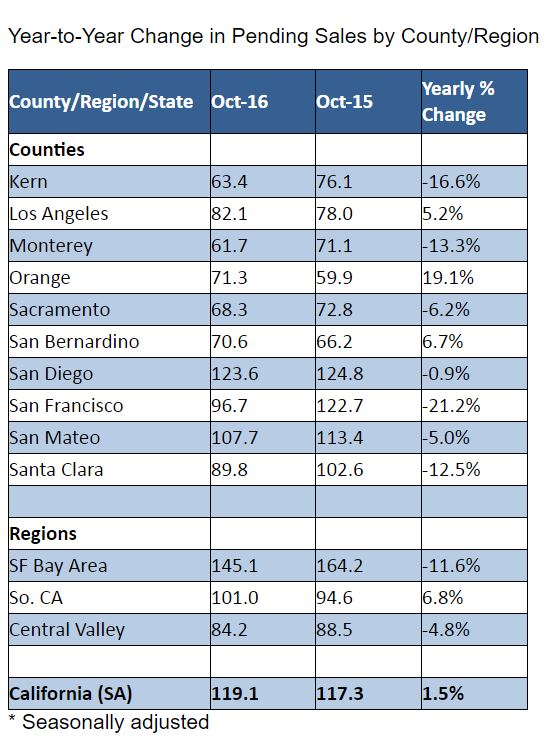
San Diego County looks like the best in the state (highest index):
*Note: C.A.R.’s pending sales information is generated from a survey of more than 70 associations of REALTORS® and MLSs throughout the state. Pending home sales are forward-looking indicators of future home sales activity, offering solid information on future changes in the direction of the market. A sale is listed as pending after a seller has accepted a sales contract on a property. The majority of pending home sales usually become closed sales transactions one to two months later. The year 2008 was used as the benchmark for the Pending Homes Sales Index. An index of 100 is equal to the average level of contract activity during 2008.


Multiple offers doesn’t mean a bidding war. It could mean that some sellers and listing agents had a few offers and screwed them up before they figured out the ‘market’.
And let’s face it, some respondents have probably been remarking on the same sale all year.
But at least the market is active!