
The San Diego Case-Shiller Index barely moved in August, which is similar to last year too. We had a big pop in July, and then a tame August reading in both 2015 and 2016.
Look forward to occasional negative readings from now on – that’s what happens in flatsville!
Here are the recent San Diego Non-Seasonally-Adjusted CSI changes:
| Month | |||
| December | |||
| January ’15 | |||
| February | |||
| March | |||
| April | |||
| May | |||
| June | |||
| July | |||
| August | |||
| September | |||
| October | |||
| November | |||
| December | |||
| January ’16 | |||
| February | |||
| March | |||
| April | |||
| May | |||
| June | |||
| July | |||
| August |
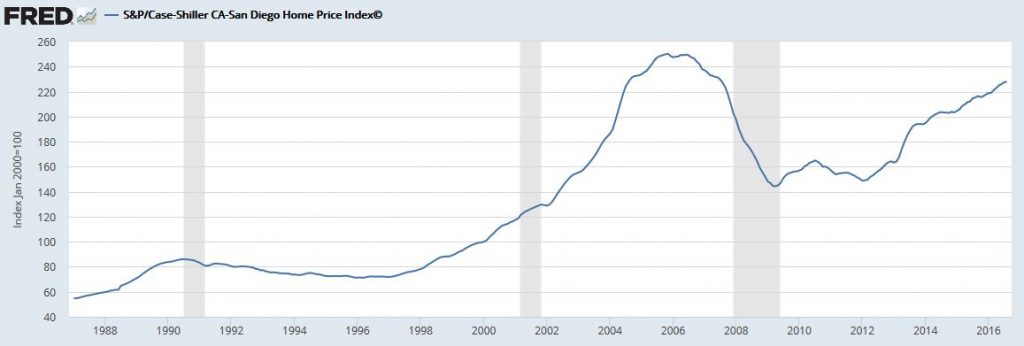
The highest reading of the San Diego NSA CSI was 250.34 in November, 2005.


