Yesterday I mentioned the idea of slightly more inventory could lead to more sales and faster-rising prices – but too much could freeze up the demand.
Is there history upon which we can reflect?
We know that the local market in 2013 reached full-blown red-hot frenzy level. Inventory for the first nine months rose 12%, and sales rose 10% – and pricing went ballistic. We probably won’t see it that hot again.
NSDCC Listings and Sales, First Nine Months (Jan-Sept.)
| Year | |||||
| 2011 | |||||
| 2012 | |||||
| 2013 | |||||
| 2014 | |||||
| 2015 | |||||
| 2016 |
But consider the 2014-2015 differences.
The inventory went up 4%, and sales went up 8%! But there wasn’t much increase in list pricing (under 4%), which probably helped to soothe the buyer anxiety, and keep things moving. The median sales price did rise 6%!
How about this year?
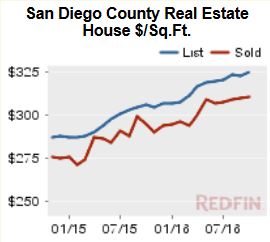
Another 3% increase in inventory, but a 4% decline in sales. But look at the increase in the median pricing – an 8% rise in the median list price and 7% increase in the median sales price, with both at all-time record highs.
There is a fine balance between sales and price, but I think if sellers can keep their pricing enthusiasm in check, the party will keep rolling! Can we all live with appreciation around 0.5% per month, where it has been for the last three years, and expect that it could be a little less as prices enter the stratosphere?