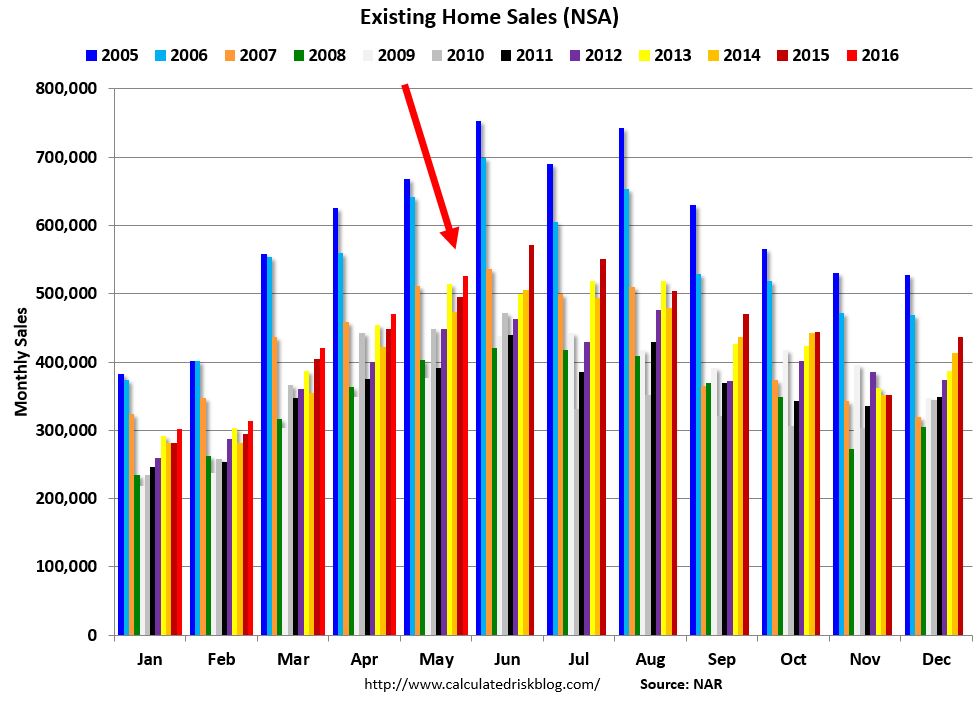
The national cheerleaders get excited about every nugget of data, and are happy to jump to conclusions. Yunnie is finally tip-toeing around the downsizing trend that we see everywhere around here, but he can’t assume that those sellers are buying too:
“The May gain over April signals that the real estate market has maintained strong momentum all spring,” says realtor.com chief economist Jonathan Smoke. “We are now in this year’s peak home buying months, and this pace of sales should produce the gains we have been forecasting that will make 2016 the best year of home sales in a decade.
The biggest challenge to prospective buyers right now is tight supply, which we have seen for 45 consecutive months. In these conditions, home values have strong support, but potential buyers will continue to face challenges finding a home for sale that meets their needs. That is why we’re seeing the age of inventory drop dramatically while prices have gone up 5 percent over the last year and are now at record nominal levels.”
Lawrence Yun, NAR chief economist, says existing sales continue to hum along, rising in May for the third consecutive month. “This spring’s sustained period of ultra-low mortgage rates has certainly been a worthy incentive to buy a home, but the primary driver in the increase in sales is more homeowners realizing the equity they’ve accumulated in recent years and finally deciding to trade-up or downsize,” he says. “With first-time buyers still struggling to enter the market, repeat buyers using the proceeds from the sale of their previous home as their down payment are making up the bulk of home purchases right now.”
Adds Yun, “Barring further deceleration in job growth that could ultimately temper demand from these repeat buyers, sales have the potential to mostly maintain their current pace through the summer.”
The local NSDCC sales in May built on the momentum from April, and the 2016 three-month total looks very similar to last year (865 vs. 859):
Monthly Detached-Home Sales, Carlsbad to La Jolla
| Year | ||||||
| 2012 | ||||||
| 2013 | ||||||
| 2014 | ||||||
| 2015 | ||||||
| 2016 |


