
More bouncing around during the late-summer months, but all positive, all year! Here are the San Diego NSA changes for 2015:
| Month | |||
| January | |||
| February | |||
| March | |||
| April | |||
| May | |||
| June | |||
| July | |||
| August | |||
| September |
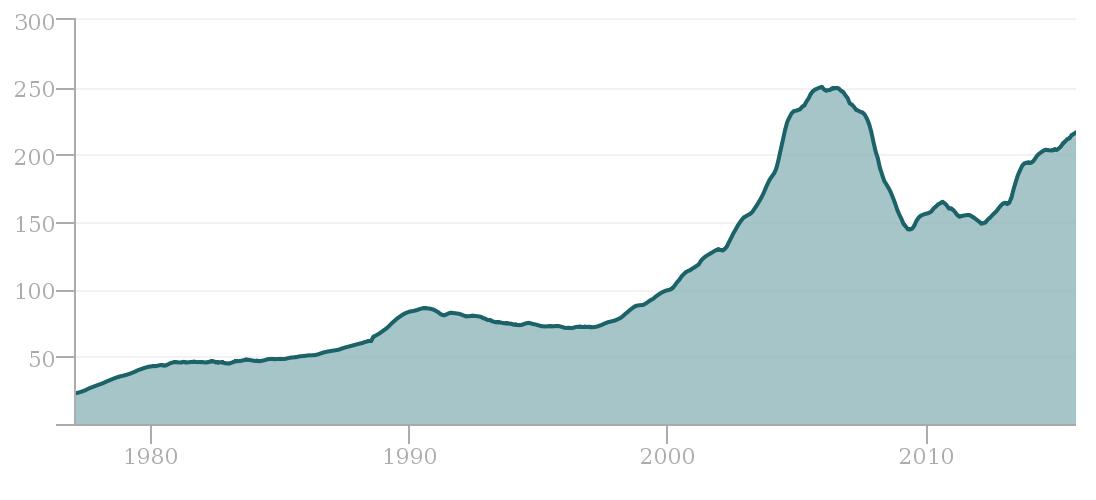
The San Diego historical graph:
The 20-City Index rose 5.5%, which was higher than the 5.2% expected.
The latest read is a sign that housing continues to show strength as home prices rise at more than double the rate of inflation, said David M. Blitzer, managing director and chairman of the Index Committee at S&P Dow Jones Indices.
“The general economy appeared to slow slightly earlier in the fall, but is now showing renewed strength,” he said in a statement.
Though most analysts now expect the Federal Reserve to raise interest rates at its December meeting, that prospect is not likely to push 30-year conventional mortgage rates much above 4 percent, Blitzer said.


