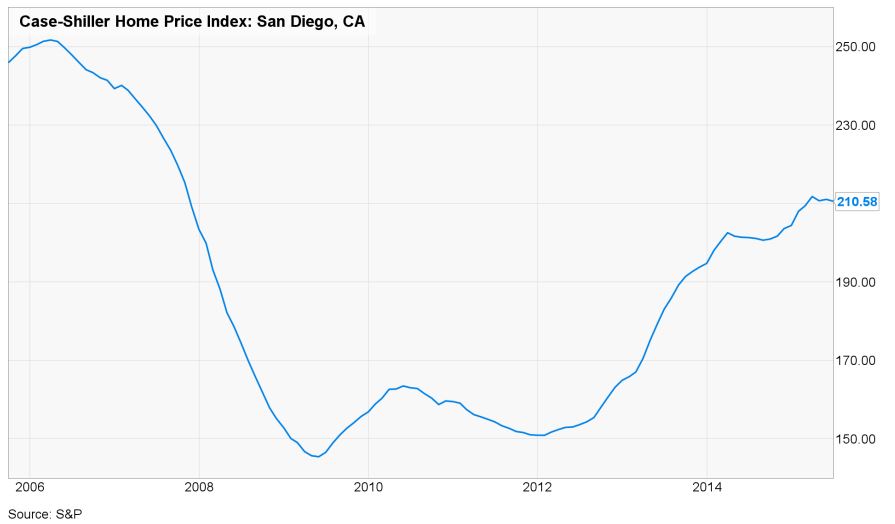
Above is a graph of the San Diego Case-Shiller Index for the last ten years.
How much higher can it go?
1. The highest reading was 251.71 in March, 2006. After that, the index dropped 42% in three years, bottoming at 145.70 in April, 2009. We have gotten about 61% of that back since.
2. Our most recent index of 210.58 is 16% lower than the peak. The no-doc funny money was probably accountable for the entire 16% difference, if not more.
3. According to the BLS, local prices only rose 0.8% in the last year, and +1.9% less food and energy. Inflation probably isn’t going to drive home prices higher in the near future.
4. It will be unlikely to see mortgage rates go down anytime soon. Expect a holding pattern in the low-4 percent range.
What could drive prices higher? Low inventory is about the only answer, and buyers are tired of hearing it. The Case-Shiller graph shows some sputtering lately, and it has only been interrupted by rates dipping back into the 3s. Without that, prices would be, and should be, flat at best.


Without new builds, it may lead to even lower inventory if prices fall (on a few must sells).
It may lead to sellers with options just pulling their listings.
It will be different in every area, and probably block by block. New-builds that sold originally in 2006-2007 could still have some struggles, where older areas that are full of long-timers could hold up fine.
Its hard to predict prices in the era of ultra cheap money and low inventory.
I was convinced the stock market was peaking two years ago because I underestimated how effective the FED could be at inflating asset prices.
Hello again Pemeliza!
I agree, it is very hard, especially in the homes vs. money category. People are paying crazy prices for homes that make no sense logically, but they value their money less.
Population-Growth > new-homes-being-built
The only group that matters = population growth of rich people who will keep paying the ever-increasing prices for homes.
Everyone else is locked out of the coastal markets. Will they go to the outskirts just to buy a house?